

Fluorescence Compensation
One consideration when performing multicolor fluorescence studies is the possibility of spectral overlap between fluorophores. Because the fluorophores used in flow cytometry emit photons of multiple energies and wavelengths, a mathematical method called compensation was developed to address the measurement of the photons of one fluorophore in multiple detectors. Due to the nature of flow cytometry measurements, a particle’s emission is measured not in a single detector, but in all the detectors being used in the experiment. For example, FITC emits photons that are green, yellow and orange, all of which can be detected on a multidetector instrument with the corresponding detectors (Figure 10). In some experiments FITC may be combined with other dyes, for example PE, that emit yellow and orange photons.
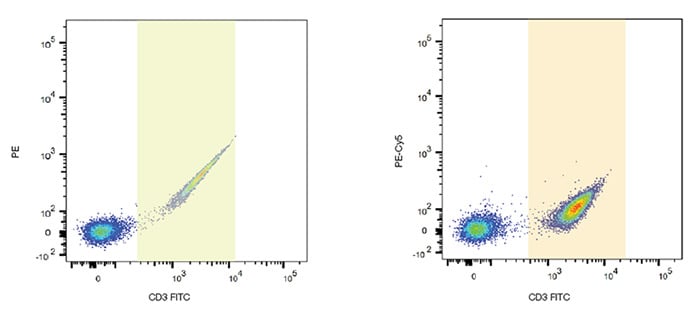
Fig. 10. FITC spillover into other channels. FITC single stained lymphocytes show spillover into PE and PE-Cy5 detectors. Gates are shown to identify the FITC positive cells and their spillover.
Relative contribution
In some experiments FITC may be combined with other dyes, for example PE, that emit yellow and orange photons. In those cases the relative contribution of each fluorophore to the signal in a given detector must be determined (Figure 11).
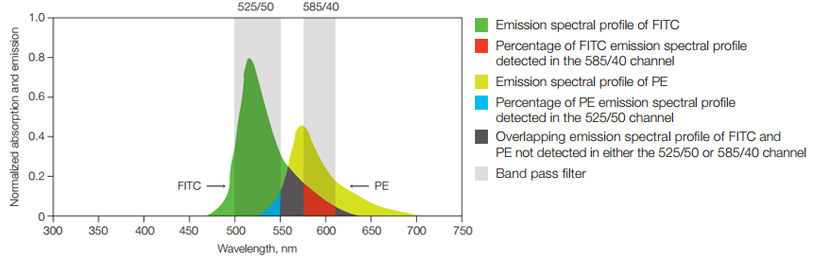
Fig. 11. Fluorescence compensation. Emission spectra of two fluorophores commonly used in flow cytometry, FITC and PE are shown. Also shown is a graphical representation of two commonly used filters, 525/50 and 585/40, to detect these fluorophores. Shown in red is the portion of the FITC spectrum that will be detected in the PE detector (585/40) and that must be subtracted from the PE signal using compensation. This process becomes even more complicated when photons from multiple dyes are detected in each PMT.
Applying compensation
We can see in Figure 12 how compensation can be applied to a sample stained with antibodies conjugated to FITC and PE. Single stained samples reveal the amount of spectral overlap. When the sample is stained with both fluorophores, without compensation, a double positive population is observed. However when the correct level of compensation is applied using software the true level of staining is revealed. The software calculates spillover values and will apply this to the data to obtain correctly compensated data. After compensation we can see that in fact there are no double positive cells, which is to be expected from these mutually exclusive markers.

Fig. 12. Fluorescence compensation corrects for spectral overlap. Peripheral blood was singly stained with CD4 FITC, CD19 PE, or both CD4 FITC and CD19 PE. When compensation was not applied, fluorescence spillover can be seen (top panel), which is removed after compensation (bottom panel).
You can avoid the need for compensation by using fluorophores that do not have overlapping emission spectra. Alternatively you can combine fluorophores that can only be activated by specific individual laser lines, (providing the lasers are spatially separated), but as you increase the number of fluorophores this becomes practically impossible. We have created common human immunophenotyping panels, using 4 fluorophores, which require no compensation. They are great to identify common populations or as a start to build larger more complex panels. To find out more about our B, T, NK and myeloid panels go to our no compensation panels webpage.
Compensation Controls
There are a few basic principles to remember when designing compensation controls for an experiment. Since compensation controls are critical to the determination of what we call positive or negative for a given marker in an experiment, they are absolutely critical to the success of the experiment. The definition of a compensation control is simple: for each fluorophore used in the experiment, a single-stained cell or bead sample must also be prepared. We will go into more detail regarding the important rules in Chapter 4, Controls in flow cytometry.