-
US | en
- Products
- Applications
- Flow Cytometry
- Flow Cytometry Explained
- Flow Cytometry Basics Guide
- Chapter 3 - Data Analysis
- Two-Parameter or Bivariate Histograms

Two-Parameter or Bivariate Histograms
These graphs display two measurement parameters, one on the x-axis and one on the y-axis and the events displayed as a density (or dot) plot. The parameters can be fluorescence, FCS or SSC depending on what you want to show. In Figure 16, the lymphocytes determined by forward and side scatter (Fig 16A) are stained with CD3 and CD19 to identify the T and B cell populations. The relative proportion of B and T cells can then be quantified by placing gates or quadrants around the distinct populations (Fig 16 B,C).

Fig. 16. Two-parameter (dual color fluorescence) density plot. Red cell lyzed whole blood was stained with CD3 A647 (MCA463A647) and CD19 PE (MCA1940PE). The relative populations were determined using different gating methods.
In this case, there are 7.5% B cells and 59.8% T cells (Figure 16B). This data can also be visualized where the density plot is split into four quadrants allowing you to determine the cells single positive for each marker and both double negative and double positive (Figure 16C). When the expression levels do not show distinct populations or are not mutually exclusive the appropriate controls will help determine the positive and negative populations.
Gating
Gating is a powerful flow cytometry tool that can be used multiple times on a dataset to refine a population of interest. The simple principle of sequential gating can be applied again and again to further determine the expression patterns on particular cell types. This is particularly useful as the number of markers and fluorophores in a single experiment increases. Currently flow cytometry can be performed on samples labeled with over 17 fluorescence markers simultaneously, although cytometers are available which can detect up to 27 colors, e.g. ZE5™ from Bio-Rad. A single experiment can therefore yield a large data set for analysis. For example, a 17 color panel would yield 136 two parameter tables.
Sequential Gating Example
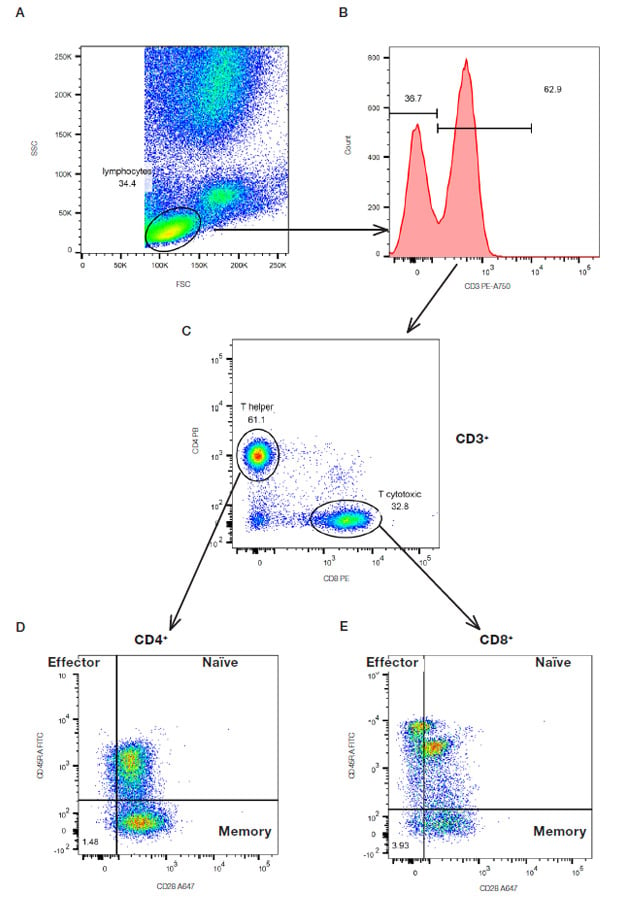
An example of a multicolor experiment where simple sequential gating has been used to identify specific cell populations is shown below in Figure 17. Briefly the lymphocytes were identified and gated by their forward and side scatter (Figure 17A). The CD3 positive T cells were then further identified (Figure 17B) and gated by the expression of CD4 and CD8 (Figure 17C). The relative expression of CD28 and CD45RA to identify CD45RA+CD28+ naïve cells, CD45RA-CD28+ memory cells and CD45RA+CD28- effector cells were then determined on both the CD4 and CD8 populations (Figure 17D and E). This principle can be continued with additional markers but it is worth noting that as the cell populations become more defined, there are fewer events within each gate showing the importance of collecting sufficient cells to answer the experimental questions.

Fig. 17. Sequential gating to identify specific T subsets. Red cell lyzed whole blood was stained with CD3 (MCA463P750), CD4 (MCA1267PB), CD8 (MCA1226PE), CD45RA (MCA87F) and CD28 (MCA709A647) in the presence of propidium iodide (1351101) to remove the dead cells. The gating strategy is shown by the arrows.
