Best Practice for Detecting Autophagy by Flow Cytometry


Introduction
Flow cytometry is a powerful technique that allows you to identify and analyze large numbers of cells in a mixed population. This enables the detection and quantification of autophagy in specific cells without pre-enrichment or sorting for your cell type of interest, which is time consuming and can stress cells leading to false positives. Performing flow cytometry over a time course can reveal how the process develops and can be used as an early screening method, allowing high sample throughput. Careful experimental set-up and interpretation of data is discussed here to make the most of your results.
Sample Preparation
For the reliable measurement of autophagy, careful cell preparation is required and all cells in an experiment should be prepared the same way for accurate comparisons to be made. Techniques to make a single cell suspension required for flow cytometry, such as trypsinization, can induce autophagy due to cellular damage caused by the harsh enzyme treatment. This can lead to false positive results. If autophagy measurements are required on adherent cells, it is also advisable to avoid cell scraping and use a gentler method of generating a single cell suspension, such as Accutase treatment. As different cell harvesting techniques may be required for different samples and the time taken to process may have an effect on the levels of autophagy sample preparation, suitable controls should always be used.
Experimental Best Practice
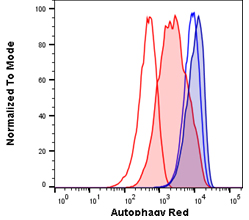
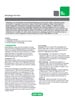
Fig. 1. Autophagy induction in Jurkats measured with different amounts of Autophagy Probe Red (APO010). Jurkat cells were either untreated for basal conditions (open histograms) or serum starved by incubation in Hanks balanced salt solution (HBSS) and in the presence of bafiloymin A1 (solid histograms) to induce high levels of autophagy. Cell staining with a 1:50 dilution of Autophagy Probe Red for 30 min (red histograms) or a 1:20 dilution for 60 min (blue histograms). Cells were washed and analyzed on the ZE5 Cell Analyzer.
The same best practices and controls that apply for other flow cytometry experiments also apply when looking at autophagy proteins. Keeping cells at 4oC is beneficial, when staining for autophagy, to reduce the stress on the cells which would cause an increase in autophagy proteins. As mentioned earlier, often staining for autophagy proteins will occur as part of a larger multiplex immunophenotyping panel. This requires careful panel design which the Bio-Rad panel builder and spectra viewer can assist you with.
Each component of your panel should be titrated beforehand, and in the case of dyes, like Autophagy Probe Red, used in our Autophagy Assay Kit Red, the concentration and staining time should be optimized for your cell type. An example of the effect using optimal versus sub-optimal staining conditions can make for Autophagy Probe Red, is shown in Figure 1. Jurkat cells with basal and high autophagy levels were stained with Autophagy Probe Red in two different conditions. Using a larger amount of Autophagy Probe Red for 60 min gives high staining in resting cells and a small increase in fluorescence following autophagy induction (blue histograms) compared to the lower concentration of probe used for 30 min (red histograms). In this example, using a 1:50 dilution of Autophagy Probe Red for a shorter time is preferable, as a larger difference is observed between basal and induced autophagy levels. Optimization of your reagents will allow you to detect smaller changes in the cells and make the data easier to analyze and interpret while saving you money.
Autophagy Flux
Autophagy flux is a measure of the speed of the whole process of autophagy from induction through to autophagosome formation, delivery of cargo to lysosomes and breakdown of cargo. Rather than looking at distinct steps of the autophagy pathway, flux is the flow through the pathway, and is considered a more reliable indicator of autophagy activity than looking at an individual autophagy protein.
It is important to consider autophagy flux when interpreting results from autophagy assays, as looking at individual proteins does not tell you about autophagy activity, for example LC3-II quantification generally correlates to autophagosome numbers, but not activity. An increase in LC3-II levels can be the result of different situations, either a result of an increase in autophagosomes due to autophagy induction, blockage of autolysosome degradation, or both. In addition, no detectable change in LC3-II levels does not necessarily mean there is no change in autophagy activity. The flux through the pathway could be increased or decreased in which case single components or proteins within the pathway may not show a detectable change in autophagy.
Measuring Autophagy Flux by Flow Cytometry
One approach to measure flux is to determine the amount of LC3-II breakdown over a certain time period after arresting autophagic degradation. The most common method is to inhibit lysosomal proteases, therefore blocking autolysosome degradation. The presence of these inhibitors causes an accumulation of LC3-II positive autophagosomes/autolysosomes and indicates high flux, while a lack of LC3-II increase indicates a defect or delay in the autophagy process earlier in the pathway than autolysome degradation. The larger the accumulation of LC3-II over a certain time, the greater the flux. Common flux inhibitors and the concentrations at which they are used are shown in Table 1.
Table 1. Common autophagy flux inhibitors mechanism of action and typical working concentrations when cells are treated for 2-4 hr.
Reagent |
Working Concentration |
Mechanism |
|---|---|---|
|
Bafilomycin A1 |
10-200 nM |
Blocks autophagosome-lysosome fusion. Inhibits vaculoar H+ ATPase (V-ATPase) |
|
Chloroquine |
25-100 µM |
Blocks autophagosome-lysosome fusion. Raises the lysosomal pH |
|
E64d |
1-25 µM |
Prevents lysosome-mediated proteolysis. A cysteine protease inhibitor |
|
Pepstatin A |
1 - 20 µM |
Prevents lysosome-mediated proteolysis. An aspartic protease inhibitor |
|
Leupeptin |
1 – 20 µM |
Prevents lysosome-mediated proteolysis. A cysteine, serine, and threonine protease inhibitor |
Ideally each experimental condition should be tested with and without flux inhibitors to allow correct interpretation of the data. The difference between the LC3-II levels with and without flux inhibitors is the amount of LC3-II degraded during the treatment period and described as the net autophagic flux.
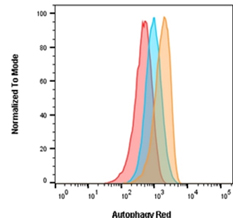
Fig. 2. Autophagy induction in Jurkats measured with Autophagy Probe Red (APO010)?. Jurkat cells were either untreated for basal conditions (red), treated with 0.5 μM rapamycin for 18 hr (blue), or treated with 0.5 μM rapamycin for 18 hr and 10 nM bafilomycin A1 for 2 hr (orange).
Autophagy Probe Red, found in our Autophagy Assay Kit Red, is an alternative reagent used to measure autophagic flux in cells. It contains a cell-permeant aliphatic molecule that fluoresces brightly when inserted in the lipid membranes of autophagosomes and autolysosomes allowing increases to be measured.
As can be seen in Figure 2, cells were treated with an autophagy activator (rapamycin) in the presence and absence of a flux inhibitor (bafilomycin A1). Experimental and control cells were stained with the Autophagy Probe Red (APO010). Staining with Autophagy Probe Red is increased over basal levels (red histogram) as autophagy is increased following rapamycin treatment (blue histogram) and a further increase is seen in the presence of the flux inhibitor (orange histogram). This demonstrates that rapamycin increases the rate (flux) of autophagy, in addition to the overall number of autophagosomes and autolysosomes present. If rapamycin did not increase the flux then there would be no additional increase in Autophagy Probe Red signal in the presence of bafilomycin A1.
Autophagy Induction and Inhibition – Detecting Autophagy in B Cells, an Experimental Example
Often only small changes in autophagy levels are seen in experiments. To ensure confidence in your results, in addition to reagent titration and good sample preparation, appropriate positive and negative controls should be included. The optimal autophagy activator or inhibitor is cell-and stress-specific so these need to be carefully chosen. Preliminary experiments should be performed in order to choose the best controls, these will be the ones that show the largest changes in autophagy levels detected by your assay. Changes are especially small in primary cells compared to cell lines, so to find the best positive and negative control, several compounds should be tested at more than one time point and concentration, to get the optimal conditions for your experiment (Cossarizza et al. 2019).
Example Data
To investigate the autophagy induction in human peripheral blood B cells, immunophenotyping was combined with the autophagy detection. The cells were incubated in the presence or absence of rapamycin to induce autophagy for up to 22 hr. Following this, the blood was stained with the antibodies and viability dye (Table 2) to enable the B cells to be identified (DAPI- CD19+ CD20+) from the other cells present in peripheral blood. The emission spectra of the fluorophores is shown (Figure 3) with Bio-Rad’s spectra viewer using the 5-laser configuration ZE5 Cell Analyzer. The cells were then stained with Autophagy Probe Red and the level of red fluorescence, corresponding to autophagy measured. Controls of untreated and vehicle alone (DMSO) were included.
Table 2. Immunophenotyping panel.
Marker |
Format |
Catalog Number |
Suggested Titration |
|---|---|---|---|
|
PE |
1:2 |
||
|
A647 |
1:5 |
||
|
A700 |
NT |
||
|
AMO |
NT |
||
|
A488 |
1:2 |
||
|
PE-A750 |
1:5 |
||
|
PB |
NT |
||
|
N/A |
|
|

Fig. 3. Spectraviewer representation of the emission spectra and optimal laser used to excite each of the fluorophores on the 5-laser ZE5 5 Cell Analyzer configuration. The red arrow denotes the 640/20 nm filter on the 561 nm laser, where Autophagy Probe Red is detected.
As can be seen in Figure 4A, a simple gating strategy was employed to exclude the dead cells and the doublets. The lymphocyte population was then determined by the forward and side scatter properties and gated to exclude myeloid cells. B cells were identified as CD19 and CD20 positive. T helper cells were identified by CD3+ CD4+ and T cytotoxic cells by CD3+ CD8+. Although not measured in this experiment, including these markers allows the autophagy flux to be measured in the T cell population as well as the B cell population. Levels of autophagy in the B cells were measured by increased levels of Autophagy Probe Red as seen in Figure 4B. Figure 4C shows how, in the B cells, autophagy increased over time and is further increased when treated with the autophagosome-lysome fusion inhibitor bafilomycin A1, showing that rapamycin increases autophagy flux in B cells.

Fig. 4. Flow cytometry detection of autophagy induction in primary B cells from human blood. A, gating strategy of cells collected on the ZE5 Cell Analyzer to identify CD19+ CD20+ B cells. B, autophagy levels in B cells were measured under basal conditions (red), following 22 hr rapamycin treatment (green) and rapamycin (rapa) + bafilomycin A1 (baf A1) for the last 2 hr (orange). Cells were stained using the Autophagy Assay Kit after staining for surface markers and analyzed on a ZE5 Cell Analyzer. C, bar chart showing MFI + SEM of red fluorescence in cells. The increase in autophagy is greatest after 22 hr treatment with rapa and Baf A1.
A caveat of using compounds in biological assays is that off target effects may occur, this is also the case for those known to regulate autophagy. One example is the autophagy inhibitor 3-MA which acts upon PI3K, upstream in the autophagy signaling pathway, and when inhibited will reduce autophagy levels. However, 3-MA will also act upon other kinases, not involved in autophagy. It is also important to include a vehicle control - the solvent that the compound is dissolved in. This is critical when the vehicle is DMSO, as DMSO has been shown to induce autophagy (Song et al. 2012). A list of commonly used activators and inhibitors used in autophagy studies is shown in Tables 3 and 4. While there are recommended concentrations for the activators and inhibitors, it is best to optimize them in your experiments to maximize the effect on autophagy and minimize off target effects.
Table 3. Commonly used autophagy inducers, all of which can be used in combination with flux inhibitors.
Activator |
Mechanism |
|---|---|
|
Rapamycin |
mTOR inhibitor |
|
Earle’s balanced salt solution |
Starvation inducer |
|
Thapsigargin |
ER stress inducer |
Table 4. Commonly used autophagy inhibitors.
Inhibitor |
Mechanism |
|---|---|
|
3MA, Wortmaninn, LY294002 |
PI3K inhibitor |
|
U0126 |
MAPK kinase inhibitor |
Lysosome Detection
Fig. 5. Cathepsin B staining in Jurkat cells. Jurkat cells were untreated (blue) or pre-treated for 1 hr with 100 µM leupeptin (red) before staining with a component of the Cathepsin B Kit, R110-(RR)2 for 1 hr. Cells were analyzed by flow cytometry using the ZE5 Cell Analyzer.
Flow cytometry can also be used to detect lysosomes and lysosomal cargos. Detecting markers on lysosomes, such as LAMP1, does not directly relate to autophagy levels in a cell. However, they are a vital component of the autophagy process as autophagosomes fuse with lysosomes allowing the contents of the autophagosome to be degraded and recycled. During autophagy, the lysosome mass decreases, and this change in mass can be measured and indicates a change in autophagy levels. Lysosomes are acidic organelles that can be identified by pH-reporting dyes. Dead cells should always be excluded from flow cytometry analysis, but even more crucial here as dead cells have fewer lysosomes and can give misleading results.
An alternative method of studying lysosomal activity in autophagy is measuring capthepsin levels. Cathepsins are lysosomal enzymes which can drive proteolytic degradation of the cargo contained in autophagosomes. Bio-Rad has kits available to measure cathepsin K, B, and L by both flow cytometry and immunofluorescence. Figure 5 above shows the changes in cathepsin levels in Jurkat cells after leupeptin treatment.
Summary
Autophagy is a cellular process that removes and recycles contents of the cell. Autophagy occurs at a basal level, but is increased during cellular stress. It is a complex process requiring good quality robust methods of detection. While there is no one clear assay that tells you quantitatively about the state of autophagy in a cell, flow cytometry can be used as an early screening technique due to its speed, ability to detect specific cells in a mixed population, and the quantitation of the data. Bio-Rad offers resources including guides, posters, tips and tricks, and interactive web tools for all aspects of flow cytometry to enable you to optimize your experiments.
As a caution, flow cytometry may not be the most appropriate application for your experiment. Visit our detecting autophagy webpage to find out how to detect autophagy using western blotting and microscopy.
For complete analysis of autophagy, it is recommended that a combination of several methods and techniques is used to gain the complete picture of autophagy activity within a cell. Changes in autophagy are open to easy misinterpretation. This is especially true when general conclusions are made using the result of only one protein involved in autophagy that may also have roles in other cellular activities, or by not looking at autophagy flux. Finally, positive, negative, and vehicle controls (if required) should be carefully chosen, dependent on the assay and cell type, to get good quality and reliable data.
References
- Cossarizza A et al. (2019). Guidelines for the use of flow cytometry and cell sorting in immunological studies (second edition). Eur J Immunol 49, 1457–1973.
- Song YM et al. (2012). Dimethyl sulfoxide reduces hepatocellular lipid accumulation through autophagy induction. Autophagy 8 (7), 1085–1097.