5 Steps to Flow Cytometry Success
Essential steps to achieving a successful flow experiment
The path to a successful flow cytometry experiment that arrives at clean, easy-to-analyze data takes a lot of planning.
There are many steps to each experiment, with each step forward reliant on the success of the preceding ones. Some steps are common to flow cytometry in general, but others will be unique to the experiment or cellular model being studied.
To ensure you have all the information and resources needed for the flow cytometry journey, Bio-Rad has compiled a comprehensive guide to help you prepare for flow cytometry experiments, including advice to help you plan your experiments, fundamental protocols, reagents you might need, and helpful tips and tricks.
Step 1: Goal – Define What Biological Question You Want Answering
What is the biological question you are asking? Fully understanding the biological system will help with the experimental design, and stop you from misinterpreting results, a few important questions are:
-
What does the cell marker expression look like? – What patterns of markers are on your target and non-target populations and equally, what markers shouldn’t be present? What defines your population(s) of interest? This is the first essential step to designing your panel to fully interrogate your sample. Knowing this information will enable you to isolate your population of interest, and in addition, it will allow you to exclude non-target cells from your analysis. Like finding your path on a map to a destination, to find your population of interest, the best practice is to plan your route of gating before ordering any antibodies or starting any experiments (see the tips section for more information). This will permit you to focus on the population of interest and eliminate any non-target cells. This is especially true when using large multiparameter panels, where positive and negative staining regimes can be used together to maximize the number of cell populations that can be investigated. Identifying cells through the markers they don’t express can be just as important as the markers that they do express.
-
What is your cell frequency? – It is also essential to know how many cells you need to analyze especially if you are collecting a limited number of events. Likewise, it is helpful to understand changes in cell frequency from control populations for disease marker investigations. For instance, when collecting a set number of events, a sample from a lymphoma patient may have a much higher number of B cells which will reduce the total number of non-B cells in your final analysis. Similarly, if you are interested in a rare population, to achieve meaningful data, it is likely you are going to need to analyze more total cells than if you were interested in a more abundant population. Details can be found on our Cell Frequencies in Common Samples page.
-
What is the expression density of the cellular markers of interest? – Knowing the expression levels of your markers of interest is an important component of multiparameter panel design. See step 2 for more information on this, but essentially, bright markers should go on low-density targets and vice versa. Otherwise, there is a risk that one abundant signal can mask all other markers through fluorescent spillover. Conversely, a dimmer label combined with a low expression marker will have insufficient signal to be detected. Our Antigen Density for Human and Murine Surface Markers is an excellent resource for further reading.
-
Where is the marker(s) of interest located and what type? – Is the marker intracellular or extracellular? Surface expression proteins, signaling molecules, or cytokines will all require different sample preparation, approaches, and potentially specialized intracellular staining buffers.
- What is the impact of cell maturation or activation status on the cell phenotype? – If the marker of interest is only expressed on activated cells, you will need to incorporate an activation step that uses beads, chemicals, or antibodies, for example, into your experimental design.
Our Biomarker Posters, Guides, and Database page is a great resource to help choose and identify markers that identify certain cell types and those commonly found in specific research areas. In addition, Chapter 7 – Uses of Flow Cytometry in Bio-Rad’s Flow Cytometry Basics Guide provides a comprehensive background to various uses of flow cytometry and popular techniques including immunophenotyping, signaling, and cell cycle analysis.
Step 2: Selection – Essential Rules to Follow to Select the Right Flow Cytometry Products
Finding the right antibodies for flow cytometry experiments has never been easier, especially with online tools like Bio-Rad’s Antibody Selection Service available to help. However, there are a few general rules that should be considered in any flow cytometry experiment.
Check that your antibodies are:
-
Supported for flow cytometry – Antibodies are manufactured by various methods and are designed to bind not only different parts of a target epitope but also different epitope conformations, such as native or denatured. This means that not all antibodies will work in every application. Check the antibodies’ product data sheet to find out which applications the antibody has been reported to work in. An antibody that works well for western blotting and immunohistochemistry might not work well in other applications, such as flow cytometry, resulting in poor quality data, maybe even obtaining a false positive or negative result.
Table 1. Antibody use table
| Application Name | Verified | Min Dilution | Max Dilution |
|---|---|---|---|
| Flow Cytometry |
|
1/50 | 1/100 |
| Immunohistology - Frozen 1 |
|
1/10 | 1/100 |
| Immunohistology - Paraffin | X |
Table 1. Manufacturers' data sheets or product web pages usually show which applications the antibody has been verified to work in including suggested starting dilutions. These tables don’t necessarily exclude the use of the antibody in unlisted applications but will need to be tested. In addition, the suggested starting dilutions are just that, it is best practice to titrate antibodies for use in the user's own system to find the optimal staining concentration.
-
Compatible with your instrument – When using primary conjugated antibodies, it is important to choose fluorophores that match your instrument’s laser, filter, and detector sets. When excited by a laser at the right wavelength, a fluorophore will emit light at a defined range of longer wavelengths. Depending on the fluorophore, this excitation and emission range can fall almost anywhere on the light spectrum. Knowing the excitation range lets you select the correct laser.
Knowing the emission range makes it possible to set up your flow cytometer for detection and, if you are using multiple fluorescent antibodies, you can check to see that the emission spectra do not significantly overlap. Overall, using fluorophores with narrow emission and excitation spectra is preferable, but not always possible. The spectral overlap from multiple fluorophores attached to individual targets requires compensation to resolve the relative contributions of each signal measured by the instrument’s detectors. The amount of compensation can be calculated in most cases by your instrument’s acquisition software, or in post-acquisition analysis. However, it is important to take the spectral overlaps into consideration in your experimental design and especially try to minimize it on co-expressing markers (i.e. two markers that are found on a particular cell type whose subtle change in expression can determine a phenotype). This will ensure that your experiment has its maximum possible resolution and sensitivity.
Panel builders will have a drop-down menu where you can select your specific flow cytometer. This should limit the list of available antibody/fluorophore combinations that are compatible with your instrument. Alternatively, most manufacturers will have a general guide available that lists typical dyes used for each channel for their instrument, such as the ZE5 Cell Analyzer Reagent Reference Guide.
Bio-Rad StarBright Dye conjugated antibodies have been designed for flow cytometry with improved brightness, narrow excitation and emission ranges (Figure 1), and broad compatibility with instruments and buffers. Explore our range to see if they can help with your flow cytometry needs.
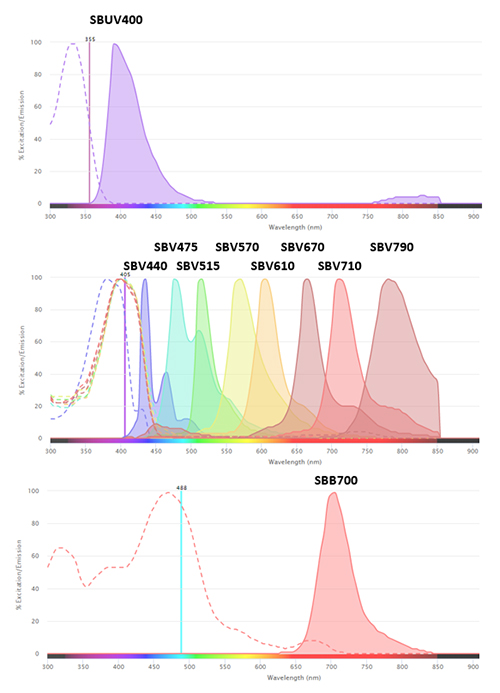
Fig.1. Excitation and emission spectra of StarBright Dyes.?
-
Reactive with the species of your cells – Species reactivity is vital in choosing the right antibody, depending on the protein being investigated there might be some cross-species reactivity for certain antibodies. However, others are more conserved and will only react with a single target species. It is best to check whether the supplier shows data from the antibody tested on cells or tissues from your species of interest or otherwise says that cross-reactivity would be expected from the immunogen sequence.
-
Buffers – One buffer may not suit all experiments! Buffers should be selected based on the experiment, staining, and cell type. A general flow cytometry staining buffer will be sufficient for many experiments. However, be aware certain dye formulations may require bespoke staining buffers for optimal performance. This information is found in the product data sheet of the conjugated antibody. In addition, analysis of intracellular proteins requires a buffer such as Leucoperm that permeabilizes the cell membrane allowing access to the proteins of interest. The Bio-Rad range of supporting reagents for flow cytometry will help you to optimize your staining and sample preparation. We also have a range of calibration and validation reagents for flow cytometry. ?
-
Multiparameter panels – For experimental panels that use multiple fluorophores, there are many best practice tips that need to be taken into consideration. The most important of which are:
- Use the panel builder to construct an appropriate multiparameter panel
- Avoid, or try to minimize, spectral overlap on closely related markers (know your biological system). Bio-Rad StarBright Dye conjugated antibodies are supported for flow cytometry and are designed to have narrow excitation and emission spectrums.
- Bright fluorophores go on rare targets and dim fluorophores go on abundant targets. This ensures that you increase the chance that you can detect smaller target populations. A bright fluorophore on an abundant population risks that the emitted signal will overwhelm and mask signals from other targets.
-
We have compiled the top 10 tips and tricks for the design of multicolor flow panels.
- Consumables – The choice of tubes, plates, and vials can be as important as the choice of the antibody. If separating a population of cells by cell sorting, an essential step is to first pass cells through a sterile filter to ensure there are no clumps and other debris. The correct mesh size should be selected depending on cell size. You can explore a range of tubes and sterile filters on the Bio-Rad webpages.
Step 3: Control – Define your Controls Before you Start
Including proper controls at the beginning of your flow cytometry experiment allows you to analyze your final data with more certainty and demonstrate that an observed change is real, caused by an experimental treatment and not by nonspecific binding, fluorescence spillover, or other unknown variables. It is tempting to skip controls as a waste of time and reagents, but the upfront investment in time and money is well worth it as it will save time troubleshooting at a later point and give your data the validity it deserves. The list below should help you decide which controls are needed before starting any experiment. However, bear in mind that you might need to consider other types of control, which can be found on our Controls in Flow Cytometry page.
Essential controls include:
-
Positive control – A biological control (e.g. patient sample or transfected cell expression system) that will conclusively show what a positive result looks like
-
Negative control – A biological control that will show baseline/background levels (i.e. knockdown/knockout cellular expression or untreated sample)
- Fluorescence minus one (FMO) – Fluorescence spread across multiple detectors must be taken into consideration when you are using multiple fluorophores with overlapping spectra. To discriminate which signals from a fluorophore are specific and to gate accordingly, it is necessary to measure how each fluorescent signal will affect the others. FMO controls are a series of sample mixtures that contain all the fluorescent conjugated antibodies that you are testing in your samples except one, this is repeated for each antibody cocktail combination in the panel. Analysis of each FMO will demonstrate how every other antibody will affect the antibody that is absent from the sample. FMO controls will help to calculate where best to set the gates for your experiment, considering the spread of fluorescence, and reliably find your target population (Figure 2 and Table 2)
Table 2. Example of FMO control layout
Full panel |
FMO #1 |
FMO #2 |
FMO #3 |
FMO #... |
|---|---|---|---|---|
|
Fluorophore A |
- |
+ |
+ |
+ |
|
Fluorophore B |
+ |
- |
+ |
+ |
|
Fluorophore C |
+ |
+ |
- |
+ |
|
Fluorophore |
+ |
+ |
+ |
- |
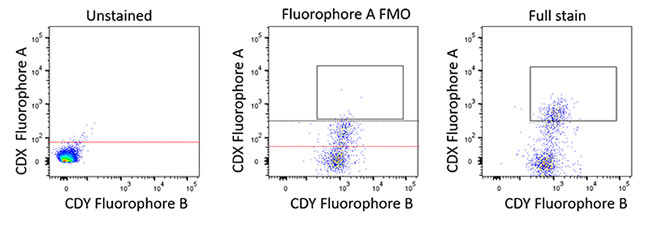
Fig. 2. Example FMO layout. For larger multiparameter panels having an FMO staining plan (Table 2) is a good idea to keep track of the staining layout. Each FMO staining will contain one missing fluorophore from the whole panel. The three plots demonstrate how this could look in practice. In this case, the FMO control data helps determine fluorescence spread as part of a 24-color panel showing fluorescence spread into the fluorophore A channel. The black line represents the FMO-based gating boundary and allows the gate to be set for the CDX-positive population. If the unstained boundary (red) had been used in this case to set gates it would have incorporated false positive data.
-
Isotype ? An isotype control is an antibody raised against an antigen not found in the cell type being studied. Their purpose is to determine nonspecific binding of controls. They should never be used to determine positive versus negative cells or to set gates and they may not be suitable for intracellular staining. When choosing an isotype control several factors should be taken into consideration. They should be selected to match the primary antibody as closely as possible with the same isotype, both by species and heavy chain, Ig subclass (IgA, IgG, IgD, IgE, or IgM), light chain (kappa or lambda), and fluorophore (with the same F:P ratio, or fluorescent particles per antibody) but have a different specific antigen target (the assumption being that the antibody target epitope isn’t expressed on the cell of interest).
All these considerations make finding the perfect isotype control challenging. However, the theory behind this practice is that by ensuring the isotype control cannot bind through a specific epitope to the cells, any resulting signal is due to nonspecific binding which would be equivalent to the nonspecific binding of the actual primary antibody conjugate. Their use is questionable, especially given the inability in most cases to find the perfect match, therefore they have largely been replaced by other more relevant controls (such as FMOs) and inclusion of good Fc blocking agents like Human Seroblock and Mouse Seroblock in combination with a viability dye into the staining panel. Their use is still continued by some researchers and they can sometimes be requested by reviewers. More details, including links to our range of isotype controls, can be found on our Isotype Controls in Flow Cytometry page.
-
Viability ? A viability control checks the health of cells. Dead or dying cells auto fluoresce and often bind nonspecifically to antibodies and other cells. This leads to false positives and makes it difficult to detect weakly positive samples or rare populations. A viability dye allows for the exclusion of dead cells from data analysis with a live/dead gate. Viability dyes such as ReadiDrop Propidium Iodide, Readidrop 7AAD, and DAPI are examples of DNA binding dyes. These dyes pass more efficiently through the compromised membranes of dead or dying cells than through the intact membranes of healthy cells. DNA binding dyes are not suitable for use in fixed cells, however when 1-2 drops of a dye like Readidrop 7AAD or Readidrop PI, that have no wash requirement, are added immediately prior to a cell sorting experiment, it can provide an up-to-date status of cell health as they continue to work as the sample is being sorted, allowing only live cells to be collected. Dyes that must be removed prior to the experiment will only give you a snapshot of the cell health at that time point and will not show you cells that died subsequent to the stain being washed away.
For samples that require fixing it is necessary to use a compatible dye such as VivaFix where the live/dead profile is preserved post-staining fixation. VivaFix dyes covalently bind to free primary amines, which in live cells are present on the cell surface. Where the membrane is compromised, the dyes permeate the cells and react with intracellular primary amines resulting in at least a 100-fold difference in fluorescence intensity between live and dead cells (see Figure 3). The wide gap in fluorescence intensity between the live and dead populations makes them easily distinguishable. In addition, they are available in a range of excitation and emission spectra for convenient addition to multicolor flow cytometry panels. See our range of Cell Health and Cell Viability Products.
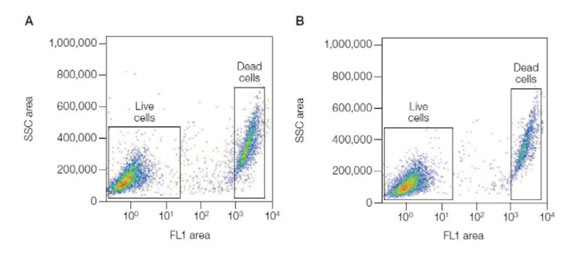
Fig. 3. Excellent separation between live and dead cells using the Vivafix Cell Viability Assay. Jurkat cells were stained with VivaFix 498/521 Cell Viability Assay, fixed with 3.7% formaldehyde (A), or not fixed (B), and analyzed with the S3e Cell Sorter. SSC, Side scatter.
Step 4: Preparation – Plan your Sample Prep Ahead of Time
There are some general principles that apply to the preparation of most flow cytometry samples. However, specific requirements still need to be considered. For instance, the preparation method chosen will depend on cell type and source, whether is it a cell suspension or primary tissue sample, and/or whether cells are fixed or unfixed. Post-fixation cell staining requires antibodies that are compatible with any chemical cross-linking of their binding epitope. Cell sorting will have its own set of particular requirements to maximize the cell sort efficiency and cell health post sort. (See tips section).
In Step 1, we highlighted that the buffer and reagent choice will depend on your experiment. The same is true of how to prepare your samples. In all circumstances, the sample that is to be analyzed on a flow cytometer will need to be a single cell suspension (contains no cellular aggregates or clumps), which is of an appropriate concentration. It is always best to pass the cell sample through a 40 µm cell strainer and then perform a cell count before subjecting your sample to staining. In the case of cell sorting, the cell straining step is best left until immediately prior to the sample going into the cell sorter. You can find more information on these methods on the Bio-Rad Flow Cytometry Sample Preparation Protocol page.
Research protocols for staining – most manufacturers will have recommended staining protocols for their own brand of antibody-dye conjugate, in general, most staining protocols overlap to some extent and only vary in incubation time, temperature, and staining buffer. As mentioned in the reagents section in Step 1, if you intend to analyze intracellular molecules you should factor membrane permeabilization into your sample preparation process.
Bio-Rad offers a free range of flow cytometry protocols and procedures to help with your experiments including:
- Preparation of PBMCs (peripheral blood mononuclear cells)
- Direct staining of cells and indirect staining of cells
- Intracellular antigen staining
- Cell cycle analysis and cell proliferation
-
Antibody induced T cell activation and pharmacological T cell activation
-
Direct and indirect staining – Direct staining uses a primary antibody conjugated to a fluorophore. Direct staining of cell surface antigens is one of the simplest staining methods as secondary antibodies are not required and reduces the number of experimental controls. Indirect staining involves using a primary antibody against your target of interest, followed by a fluorophore-conjugated secondary antibody targeting the primary antibody species. Typically, this approach is used when there is no fluorophore-conjugated primary antibody available. However, it is possible to simply conjugate a primary antibody with fluorescent labels specific for flow cytometry, using a simple antibody conjugation kit. Otherwise, see our guide for staining with confidence using secondary detection reagents and indirect staining in flow cytometry.
-
Intracellular and cell surface staining – Intracellular staining to look at markers such as cytokines requires permeabilization (Figure 4). Different protocols might be required depending on the antigen and antibody used, and in certain circumstances, as in the case of FoxP3, might require a special buffer. However, in general, the staining of surface antigens takes place first, followed by the use of cell fixation and cell permeabilization reagents like Leucoperm. Leucoperm follows a two-step process that will first fix the cells and then permeabilize the cell membrane to allow intracellular antigen analysis of targets such as cytokines and cytoplasmic proteins with minimal effect on cellular morphology or prior surface staining. An important consideration is the use of protein transport inhibitors like Monensin and Brefeldin A. These agents act to inhibit the secretion of cytokines and chemokines out of the cell, trapping them in the Golgi apparatus and endoplasmic reticulum and thus enhancing intracellular cytokine staining.
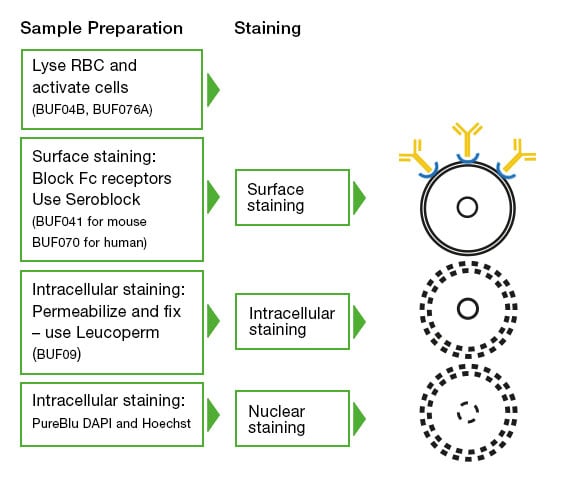
Fig. 4. Cell preparation and staining workflow. The cleanest data will come from a well-planned and executed stepwise staining regime. Starting with the cell surface staining, then fixing, permeabilizing, and staining intracellular targets and nuclear staining, if required. At each step, careful use of controls will make the final data analysis easier.
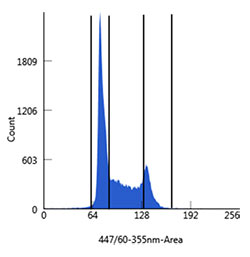 Fig. 5. Analysis of DNA content of Jurkat cells. Cultured cells were harvested, washed in phosphate buffered saline (PBS), and fixed in cold 70% ethanol for 2 hr at 4°C. The Jurkat cells were then washed in Bio-Rad Staining Buffer (BUF073) and stained with PureBlu DAPI Dye containing 0.1% Triton X-100 for 30 min. Cells were first gated to discriminate single cells and then plotted into histograms discriminating G1, S, and G2/M populations. All flow cytometry was carried out on a Bio-Rad ZE5 Cell Analyzer (12004279).
-
Cell cycle analysis – Cell cycle analysis is based on the principle that dividing cells have different amounts of DNA depending on the cycle stage. DNA must be stained in order to quantify it, and since DNA is intracellular, permeabilization is required.
Propidium iodide (PI), 7-aminoactinomycin D (7-AAD), and DAPI/Hoechst 33342 are popular dye choices for cell cycle analysis. As an example, a simple protocol for how to use the ZE5 Cell Analyzer in combination with PureBlu DAPI to analyze DNA content in Jurkat cells is shown in Figure 5.
-
Cell proliferation – It can be useful to track cell division/proliferation for a variety of reasons, including drug development, cytotoxicity, or general monitoring of cell health. Reagents such as CFDA-SE or CytoTrack Cell Proliferation Assays are cell permeable reagents that are able to track up to ten cell divisions in the case of Cytotrack. The dye comprises a fluorophore, a fluorescence blocker, and a cell-retaining group.
Upon entering a live cell, the fluorescence blocker is cleaved by intracellular esterases, and the cell-retaining group of the fluorophore reacts with intracellular proteins to create a stable, covalent bond. As the cells divide, the fluorescence intensity is successively halved, and each cell division is identified and analyzed on a flow cytometer (see Figure 6 below). The rate of cell division and growth can be a key marker in apoptosis and cytotoxicity. Cell proliferation dyes are a great way to investigate the effect of a treatment on your cell population of interest.
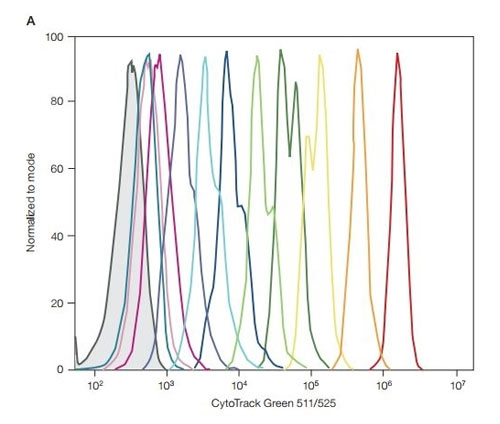
Fig. 6. CytoTrack Green performance on the ZE5 Cell Analyzer. 1x CytoTrack solution in cell culture media was added to 1 x 10⁶ Jurkat cells/ml. Cells were incubated in the dark at room temperature for 15 min, then washed and resuspended with cell culture media or DPBS buffer. Half were analyzed on the ZE5 Cell Analyzer (Day 0) and the other half were left to grow. Each day, half of the sample was removed and analyzed on the ZE5 Cell Analyzer and the cell culture was replenished. DPBS, Dulbecco’s phosphate buffered saline. Day 0 is the far right (red) peak, days 1-10; in between peaks, the negative far left (grey) peak.
Alternatively, cell proliferation can be measured by staining cells against proliferation markers such as Ki67, MCM2, or PCNA, or by incubating cells with BrdU. BrdU is incorporated into the cell’s DNA during S-phase of the cell cycle, it can then be detected using fluorescently labeled anti-BrdU antibodies. When combined with a DNA stain like PI or DAPI, the relative proportion of cells in S-phase can be determined.
-
Cell activation – Many experiments rely on cell activation using pharmacological reagents and antibodies, for instance, some targets cannot be measured on T cells until they are in an active state. Protocols for T cell activation can be found on the protocols page above. Bio-Rad supplies a cell stimulation reagent based on chemical activation with phorbol-12-myristate-13-acetate (PMA) and ionomycin, containing Brefeldin-A to inhibit intracellular transport. If the cell stimulation agent you are using doesn’t contain a protein transport inhibitor, like Brefeldin-A or Monensin, including one will enhance intracellular cytokine staining.
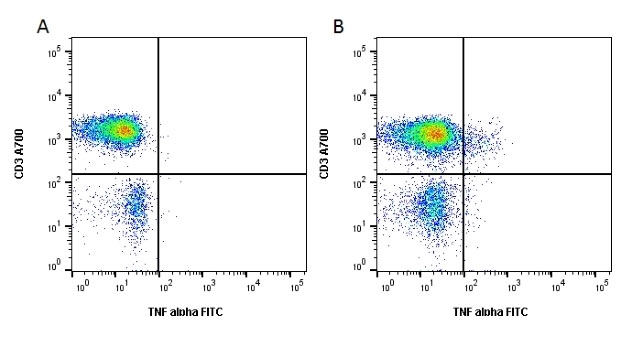
Fig. 7. Cell stimulation increases the release of cytokines from lymphocytes. Unstimulated cells were stained with Alexa Fluor 700 conjugated Mouse Anti Human CD3 (MCA463A700) and FITC conjugated Mouse Anti Human TNF alpha (MCA1395F). Figure B. Cells stimulated with Cell Stimulation Reagent containing Brefeldin A (BUF077A) for 6 hours were stained with Alexa Fluor 700 conjugated Mouse Anti Human CD3 (MCA463A700) and FITC conjugated Mouse Anti Human TNF alpha (MCA1395F). All experiments performed on red cell lysed human blood gated on lymphoid cells in the presence of 10% human serum. Data acquired on the ZE5 Cell Analyzer.
More general protocols can be found on our Flow Cytometry Protocols page
-
Titrate your antibodies – The recommended test volume on most antibody data sheets is a suggested starting point. The antibody manufacturer will suggest a dilution based on their testing, but it is not necessarily the best for every experiment. The optimal staining volume for your particular sample may be significantly more or less than the recommended volume (see typical titration experiment example, Figure 8) and is dependent on the experiment, staining conditions, cell type, and many other factors. Titrations should be carried out on the cells of interest in the experimental buffer. Take into consideration that the optimal staining index may be affected when cells are stimulated or by any experimental treatment compounds.
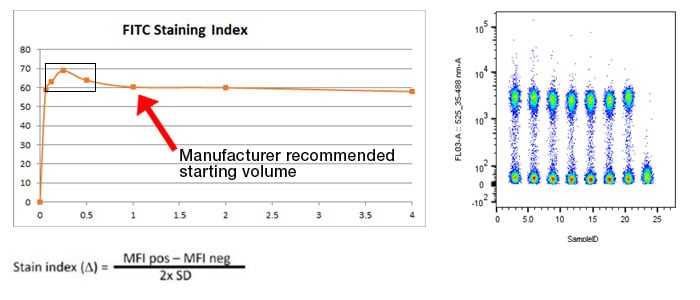
Fig. 8. Example titration experiment: Here is a typical titration experiment for a marker conjugated to FITC. Cell samples were stained with 7 different concentrations of antibody ranging from 0.065x to 4x the recommended starting volume as outlined on the product datasheet. The resulting staining index is calculated with the equation and plotted on a chart. The box highlights the optimal staining index with the best separation between positive and negative samples for this particular conjugated antibody. This value may vary between antibodies significantly and the titration will need to be repeated if experimental conditions change or a new lot is required.
We have a dedicated section on our website that covers in more detail Antibody Titration in Flow Cytometry
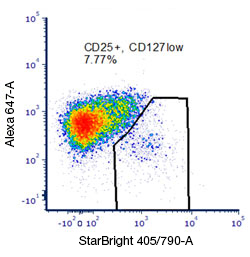 Fig. 9. Rare or low abundance population detection: Careful experimental and panel design is essential for maximum cell population resolution to allow discrimination of less abundant cell populations such as Treg cells. Following the steps outlined here such as placing bright markers on low expressing populations, minimizing spectral overlap, lysing red blood cells, and adding a dump channel will all help with uncovering and analyzing with confidence all the cell populations of interest. Here, exploiting the bright characteristics of StarBright Dye 405 has allowed a clear determination of the CD25 positive population of cells typical of Treg cells.
-
Perform a cell count – Counting cells from the prepared sample after running through a cell filter is an important step to ensure that there will be sufficient cells for the whole experiment and to achieve a target number. This is especially important when looking at rare cell types or lower frequency cells such as stem cells or Tregs. Analyzing a total event number that is too low could result in too few cells in the rare cell population for a meaningful analysis.
Additionally, the analysis of white blood cells provides a specific example of the importance of appropriate sample preparation. In whole blood, red blood cells outnumber white blood cells by a ratio of approximately 600 to 1. When studied using flow cytometry, red blood cells can mask signal from white blood cells. Therefore, to analyze white blood cells from whole blood, red blood cells should be lysed using red blood cell lysis buffer such as Erythrolyse. Cell counts of the remaining leukocytes can then be performed on a TC20 in combination with Trypan Blue to check the cell viability.
-
Sample prep affecting marker expression – Depending on how the cell sample is prepared can have an impact on the cellular protein expression patterns. In certain circumstances, treating cells with a stimulating reagent such as Cell Stimulation Reagent prior to analysis would be desirable, i.e. to mimic an activated or disease state and increase the expression of associated markers.
However, leaving a cell sample in dissociation buffer, trypsin, or other non-physiological buffer or temperature, for too long can also have an adverse effect on surface marker expression. Therefore, tissue digestion and cell dissociation times should be kept to a minimum. In general, sample preparation should be as gentle and as quick as possible, increasing cell viability and reducing the accumulation of cellular debris.
Step 5: Settings – Setup and Confirm your Flow Cytometer Settings
Before an experiment, you should set up and confirm the settings on your flow cytometer. Check the correct lasers and filter sets for your fluorophores of interest are selected. Ensure that voltages have been adjusted correctly, allowing you to see both negative and positive populations on the scale and keep them the same across samples. Check the instrument is running correctly and has passed its daily QC. There are many more considerations that are outlined in the Introduction to Flow Cytometry – Basics Guide.
When using multiple fluorophores, there will be additional factors to pay attention to. We have already mentioned some of these considerations when using multicolor panels, such as using FMO controls and avoiding overlapping spectra. The Bio-Rad Panel Builder can help you design robust multicolor experiments.
Gates allow us to separate target populations from the overall mass population of cells, and interrogate them for information e.g. phenotypic changes, health markers, or expression profiles of proteins of interest. We can use gates to separate a population of lymphocytes from macrophages, dead cells, and debris. Gates are based on common characteristics, such as cell size or expression of a particular protein identified by a fluorescently conjugated antibody. It is essential to set appropriate gates for your experiments and keep them consistent across samples. This avoids accidentally including lymphocytes in a macrophage population, for example, or including dead cells when we only want to analyze live ones. You can find more about gating, and how to set up appropriate gates for your experiments, using our guide.
Helpful Flow Cytometry Tips
Here are some top tips for successful flow cytometry experiments. Planning a flow cytometry experiment is complex, and the list below is not exhaustive but should provide an additional resource for your flow cytometry needs.
1) Remove doublets, dead cells, and others
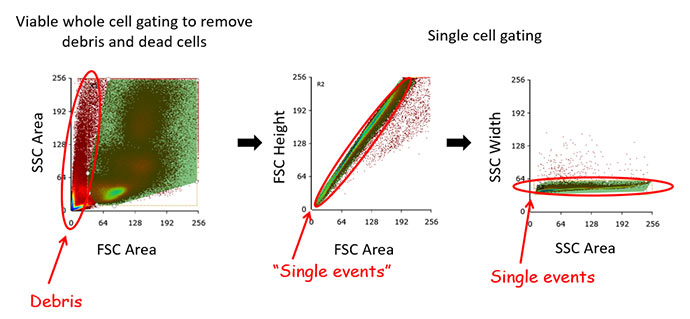
Fig.10. Single cell gating of primary bone marrow. Removing doublets and clumps of cells improves the quality of data as it ensures that only single cells are analyzed and quantified. There are many ways to gate for single cells but a common one is to gate on scatter area and height plots.
-
Doublet discrimination ? ensures that only single cells are included in your analysis. This is critical for appropriate data interpretation, particularly in cell sorting where collecting distinct positive and negative populations is important. In a situation where a positive cell forms a doublet with a negative cell, they will produce a positive signal as they pass through the laser line resulting in a false positive. This will result in reduced sort purity or inaccurate flow data analysis statistics. There are a number of ways to gate for doublet discrimination to ensure you are looking at single cells. Our recommendation is plotting forward scatter (FSC) height vs area and apply an appropriate gate followed by side scatter (SSC) height vs area and applying a gate (Figure 10). This two-gate technique ensures maximum resolution for your single cells. As can be seen in Figure 10, the use of the FSC-A FSC-H single gate would still result in undesired cells in any downstream analysis, however, they can be excluded by the SSC single events plot.
-
Dead cells ? Cellular debris is usually FSC-low and dead cells often have lower forward scatter and higher side scatter than live cells. However, the use of forwarding and side scatter gating may not remove all dead cells and some nonspecific binding may still be present so the use of a live/dead stain is essential. As discussed in Step 2, dead cells can be highly autofluorescent and often bind nonspecifically to antibodies, affecting results. Along with doublets, dead cells should be gated out. In most flow cytometry and cell sorting experiments, it is best practice to include a viability dye in your experiment. The presence of dead cells can affect staining, they have increased autofluorescence and increased nonspecific binding and therefore affect the final quality of your data. It is important to ensure that your cell viability dye is compatible with fixation when necessary. You can find the Bio-Rad ranges of cell health products including fixation compatible viability dyes on our Cell Viability Products page.
-
The others – The use of a ‘dump channel’ is a useful method to exclude multiple cell populations at the same time and save fluorescence markers for target populations. Typically, multiple antibodies conjugated to the same fluorophore are used to target markers expressed on unwanted cells but not on the cells of interest. For example, if the investigator only wanted to analyze the T cell population from a PBMC sample, they could use a dump channel to target all the non-T cells (e.g., B cells, NK cells, monocytes, etc.) by using multiple antibodies, that are all conjugated to the same fluorophore, targeting those cells and eliminate them from the analysis. This has the added benefit of removing any unwanted binding or fluorescence spillover and spread caused by those cells from the primary analysis. The use of a dump channel is particularly helpful when analyzing rare cell populations such as stem cells.
2) Update your protocols for cell sorting
Sorting cells by flow cytometry present its own unique set of requirements and challenges. Most applications downstream of cell sorting experiments require the sorted cells to retain their integrity after sorting such that they can be used for further analysis. This necessitates careful choice of collection buffer (the buffer that cells are collected into after sorting) to maintain cell health. The temperature should be optimized for the same reason. For more information, see our article that provides 10 Tips for Setting up a Successful Cell Sorting Experiment.
3) If not fixing cells, analyze them quickly
Fixing your cells with reagents such as Cell Fixation Buffer kills them but preserves their current state, including protein abundances. Fixed cells are therefore a good representation of cellular state at the time of fixation. There is little time pressure in which to use fixed cells, which can be stored until the flow cytometer is available. However, unfixed cells need to be analyzed quickly before the staining integrity is compromised, the biological effect that you want to observe wears off, or simply the cell health deteriorates. In addition, cell fixation is a prerequisite to intracellular cytokine or protein staining. Cell fixation is used prior to permeabilization of the cell, reagents such as Leucoperm can provide a complete solution for fixation and subsequent permeabilization.
4) Get familiar with conjugation kits
Many antibody vendors, including Bio-Rad, stock a range of conjugated primary antibodies validated for flow cytometry. However, not every target is available as a conjugate. Fortunately, it is possible to conjugate your own antibody to a fluorescent protein in your lab. Bio-Rad offers both ReadiLink and Lynx Antibody Conjugation Kits for fast, one-step conjugation of proteins and antibodies. The kits don’t require a post-conjugation clean-up step, so the antibody is ready to use immediately.
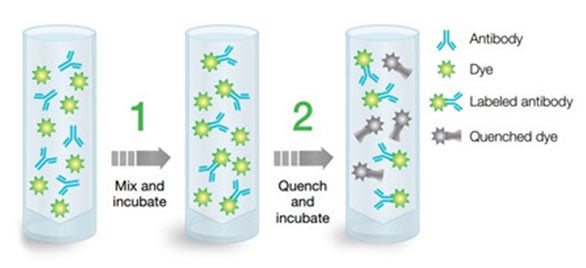
Fig. 11. ReadiLink conjugation kits illustration. ReadiLink conjugation kits quickly and efficiently conjugate microscale volumes of antibody (50-100 µg) in two easy steps with the unique chemistry of ReadiLink Dyes.
5) Get organized
The final step for a successful flow cytometry experiment is to make sure everything is in place and ready to use before starting the experiment. It seems obvious, but there are many parts to a flow cytometry experiment. Factors, such as ensuring the cells are ready on the day that your flow cytometer is available are clearly important for samples that need to be analyzed or sorted fresh. In addition, it is important if you are using a core facility, for instance, to have enough time to prepare and stain cells as required before the instrument reservation time. Bear in mind it can also take time to set up an experiment on the instrument, meanwhile, if your sample is stained but unfixed it can be slowly deteriorating. So, if possible, set up the experiment on the instrument ahead of time and have it saved ready for import when everything is ready to go.
Bonus Tip - Bringing Your Flow Needs Together
One last tip is to have a shopping list, so everything is in place when you are ready to prepare your cells for flow cytometry.
Shopping List - Simple Immunophenotyping Flow Cytometry Experiment
| Preparation |
|
|---|---|
|
Flow Cytometry Protocols ready for staining, sample isolation, |
|
|
|
|
|
Order Reagents:
|
|
|
Order/acquire sample |
|
|
Book time on flow cytometer |
|
|
Pipettes and tips |
|
|
Plates/tubes (polypropylene for reduced cell binding) |
|
|
Centrifuge |
|
| Sample Preparation |
|
|---|---|
|
PBS |
|
|
Pre-sort and post-sorting media |
|
|
Cell culture media |
|
|
Cell dissociation buffer/cell scraper (optional/assay dependent) |
|
|
|
|
|
Transport inhibitor (Monensin, Brefeldin A - optional/assay dependent) |
|
|
Cell stimulation reagent (optional/assay dependent) |
|
|
|
|
|
Viability stain (trypan blue) |
|
|
|
|
|
|
| Sample Staining |
|
|---|---|
|
|
|
|
Compensation beads |
|
|
Unstained sample |
|
|
Single color control |
|
|
FMO control |
|
|
|
|
| Antibody panel | |
| Viability dye |
| Sample Acquisition |
|
|---|---|
|
Flow cytometer QC completed |
|
|
Experimental setup and plate map configured |
|
|
Voltages adjusted with unstained or single color controls |
|
|
Calculate compensation |
|
|
Memory stick (thumb drive) |
|
|
|
For all things flow cytometry, don't forget to take a look at our Flow Cytometry Hub. This essential Bio-Rad resource includes an invaluable knowledge base called Flow Cytometry Explained, where you can learn flow your way with additional guides, protocols, webinars, online tools, and blogs.


