Technical Note: Benefits of Using StarBright Dyes

- On This Page
- Introduction
- Materials and Methods
- Results
- Conclusion
- Appendix
- Resources
A Study Comparing the Benefits of Using StarBright Ultraviolet, Violet, and Blue Dye–Conjugated Antibodies to Commonly Used Fluorophores for Human Immunophenotyping
 A Study Comparing the Benefits of Using StarBright Ultraviolet, Violet, and Blue Dye–Conjugated Antibodies to Commonly Used Fluorophores for Human Immunophenotyping
This study demonstrates that StarBright UltraViolet, Violet, and Blue Dye–conjugated antibodies have improved population resolution compared to alternative fluorophores commonly used in conventional flow cytometry.
For an immunophenotyping panel to have superior population resolution, it requires careful selection of fluorophores that are bright with low spillover and spreading to avoid masking signals in other channels.
Here, we demonstrate that the incorporation of StarBright UltraViolet, Violet, and Blue Dyes into your panel can reduce overall compensation and spreading and can give an average increase in brightness, resulting in improved identification of cell populations compared with other fluorophores.
Introduction
StarBright™ Dyes have been developed to have properties that make them ideal for inclusion in flow cytometry panels. They are exceptionally bright with narrow excitation and emission profiles, making them a great choice for multiplexing. They work in all buffers tested but do not require a special buffer when used in a panel containing more than one StarBright Dye–conjugated antibody. Other polymer fluorophores require a special buffer to prevent unwanted interactions when more than one fluorophore is used. These features enable StarBright Dyes to fit into existing panels easily and mean that they are compatible with almost all common flow cytometry protocols. StarBright Dyes are also stable in a master mix for up to 6 months when stored at 4ºC. This makes them ideal for premixing and staining multiple samples in long-term studies, enabling consistent staining, reduced time spent preparing samples, and fewer errors compared to making up a fresh master mix each time.
To assess the performance of StarBright Dyes alongside common alternatives, spectral traces of the same anti-human CD4 antibody clone conjugated to StarBright Dyes or a comparable fluorophore were first generated using the Bio-Rad ZE5 Cell Analyzer. Comparable fluorophores were selected based on having similar maximum excitation and emission wavelengths to the StarBright Dye they were being compared with. Next, the performance of these dyes was evaluated by staining human peripheral blood cells from the same donor with two 17-color immunophenotyping panels. The first panel included antibodies conjugated to StarBright UltraViolet (SBUV), StarBright Violet (SBV), and StarBright Blue (SBB) Dyes, and the second panel included antibodies conjugated to the following fluorophores: Brilliant UltraViolet (BUV), Brilliant Violet (BV), Brilliant Blue (BB), and phycoerythrin (PE) tandem dyes. The brightness of the fluorophores, spillover, and spreading in both panels were compare do assess their performance in an immunophenotyping panel.
Materials and Methods
Flow Cytometry Spectral Profile Staining
Red blood cell–lysed human peripheral blood was blocked in 10% human serum. Cells were incubated with Mouse Anti-Human CD4 Monoclonal Antibody (clone RPA-T4; Bio-Rad Laboratories, Inc., catalog MCA1267) conjugated to the appropriate fluorophore for 1 hr at room temperature (RT), washed three times (3x) in phosphate buffered saline containing 1% bovine serum albumin (PBS/BSA), and resuspended in PBS/BSA. A live/dead marker was added before acquisition to exclude dead cells. Spectral profiles from all StarBright Dyes and the alternative fluorophores used in the panels were generated. All antibodies were titrated to determine the optimal staining concentration prior to use. Conditions were kept consistent when generating the spectral profiles to allow accurate comparison, using blood from the same donor and performing staining in one 96-well plate, ensuring identical washing and incubation times.
Flow Cytometry Panel Staining Protocol
Red blood cell–lysed human peripheral blood was incubated with VivaFix 353/442 Cell Viability Assay (Bio-Rad, 1351111). After washing and blocking in 10% human serum, cells were stained with the antibody panels (or a single antibody for compensation control samples) in PBS/BSA or BD Horizon Brilliant Stain Buffer (BD Biosciences, 563794). Cells were incubated for 1 hr at RT, washed 3x in PBS/BSA buffer, and resuspended in PBS/BSA before acquisition. Using a single 96-well plate, cells from the same donor were stained in both panels, ensuring consistency in staining conditions for accurate comparison of the two panels.
Panel Design
Best practices for panel design were followed:
- Fluorophores were chosen that were maximally excited by different lasers to utilize all lasers of the cytometer. For these experiments, fluorophores were spread across all 5 lasers on a 5-laser (5-L) ZE5 Cell Analyzer
- Antigen density and fluorophore brightness were considered, and any marker with a high antigen density was paired with a dim fluorophore. For example, CD45, a marker with a high antigen density, was detected using dimmer fluorophores: SBUV510 or BUV496
- In large panels, due to the high number of fluorophores used, it is inevitable that some fluorophore pairs with high spillover and spread will be used. This effect can be minimized by placing fluorophores with spillover onto antibodies that detect antigens expressed on mutually exclusive cells. For example, SBUV575/BUV563 and PE have a higher spillover and spread, so they were used to detect CD19 and CD16, which are expressed on different cell types
- Antibody titration was performed prior to use in panels to determine the optimal antibody concentration for the best separation with low background fluorescence
Design features to ensure panel performance comparison were incorporated:
- Comparison fluorophores were chosen based on their similar excitation and emission maximums to the corresponding StarBright Dyes
- StarBright Dyes and the alternative fluorophores have different amounts of spillover due to cross-laser excitation, which can increase spreading and reduce cell resolution in multiplex panels. To evaluate this, both panels included additional fluorophores that are detected in filters where a spillover signal is present. The two panels were compared by measuring the amount of compensation required and the amount of spreading. SBUV605, BUV615, SBV610, and BV605 all show cross-laser excitation by the 561 nm laser; therefore, two 561 nm excitable fluorophores were included, PE and PE-Cy5. In contrast, most of the 355 nm and 405 nm excitable fluorophores show cross-laser excitation by the 640 nm laser; therefore, two 640 nm excitable fluorophores, Alexa Fluor 647 (A647) and Alexa Fluor 700 (A700), were included.
Antibodies used in the multiplex panels are shown in Table 1.
Table 1. Antibodies used. StarBright Dye– and comparison fluorophore–conjugated antibodies used in the multiplex panels.
| Marker | ZE5 Cell Analyzer Target Laser: Filter | StarBright Dye Panel (Bio-Rad Catalog Number) | Comparison Fluorophore Panel (Catalog Number) |
|---|---|---|---|
|
CD45 |
355: 509/25 |
SBUV510 (MCA87SBUV510) |
BUV496 (BD Biosciences, 750179) |
|
CD19 |
355: 577/15 |
SBUV575 (MCA1940SBUV575) |
BUV563 (BD Biosciences, 612917) |
|
CD8 |
355: 615/24 |
SBUV605 (MCA1226SBUV605) |
BUV615 (BD Biosciences, 612995) |
|
CD14 |
355: 670/30 |
SBUV665 (MCA1568SBUV665) |
BUV661 (BD Biosciences, 741603) |
|
CD3 |
355: 750LP |
SBUV795 (MCA463SBUV795) |
BUV805 (BD Biosciences, 612896) |
|
CD28 |
405: 525/50 |
SBV515 (MCA709SBV515) |
BV510 (BioLegend, Inc., 302935) |
|
CD25 |
405: 615/24 |
SBV610 (MCA2127SBV610) |
BV605 (BioLegend, Inc., 302631) |
|
CD27 |
405: 720/60 |
SBV710 (MCA755SBV710) |
BV711 (BioLegend, Inc., 356429) |
|
CD45RO |
405: 750LP |
SBV760 (MCA461SBV760) |
BV750 (BioLegend, Inc., 304261) |
|
CD57 |
488: 525/35 |
FITC (MCA1305F) |
FITC (Bio-Rad, MCA1305F) |
|
CD4 |
488: 593/52 |
SBB615 (MCA1267SBB615) |
PE-Dazzle 594 (Biolegend, 300548) |
|
CD20 |
488: 692/80 |
SBB700 (MCA1710SBB700) |
BB700 (BD Biosciences, 745889) |
|
CD16 |
561: 583/30 |
PE (MCA2537PE) |
PE (Bio-Rad, MCA2537PE) |
|
CD127 |
561: 670/30 |
PE-Cy5 (BioLegend, Inc., 351324) |
PE-Cy5 (BioLegend, Inc., 351324) |
|
CD62L |
640: 670/30 |
A647 (MCA1076A647) |
A647 (Bio-Rad, MCA1076A647) |
|
CD45RA |
640: 720/60 |
A700 (MCA88A700) |
A700 (Bio-Rad, MCA88A700) |
|
Live/Dead dye |
355: 387/11 |
VivaFix 353/442 (1351111) |
VivaFix 353/442 (Bio-Rad, 1351111 |
Axxx, Alexa Fluor; BB, Brilliant Blue; BUV, Brilliant UltraViolet; BV, Brilliant Violet; FITC, fluorescein isothiocyanate; PE, phycoerythrin; PE-Cy5, phycoerythrin-cyanine5; SBB, StarBright Blue; SBUV, StarBright UltraViolet; SBV, StarBright Violet.
Data Collection and Analysis
Cells were acquired on a 5-L, 30-parameter ZE5 Cell Analyzer (Bio-Rad) with the option A, 355 nm laser configuration. For the multiplex panel, 150,000 cells were acquired, and 60,000 were acquired for single-stained controls and anti-human CD4 staining. To generate the spectral profiles, all lasers were switched on and data were collected from every filter. Analysis was performed using FCS Express 7 Software (De Novo Software) for the panels and FlowJo Software version 10 (BD Biosciences) for the anti-human CD4 spectral profiles. Cells were gated on live, single cells.
Results
Spillover of StarBright Dyes and Comparison Fluorophores
Spillover occurs when the emitting signal is detected by offtarget filters. One method to determine spillover is to generate a spectral profile of a fluorophore showing the signal in each filter as a percentage of the target filter. The spectral profiles of all the StarBright Dyes and the corresponding alternative fluorophores, conjugated to anti-human CD4 (RPA-T4 clone), were generated, as shown in Figure 1. The spectral profiles were generated using a 5-L ZE5 Cell Analyzer flow cytometer. Note that laser power, filter configuration, and detector type affect spectral profiles, so profiles will vary between cytometers.
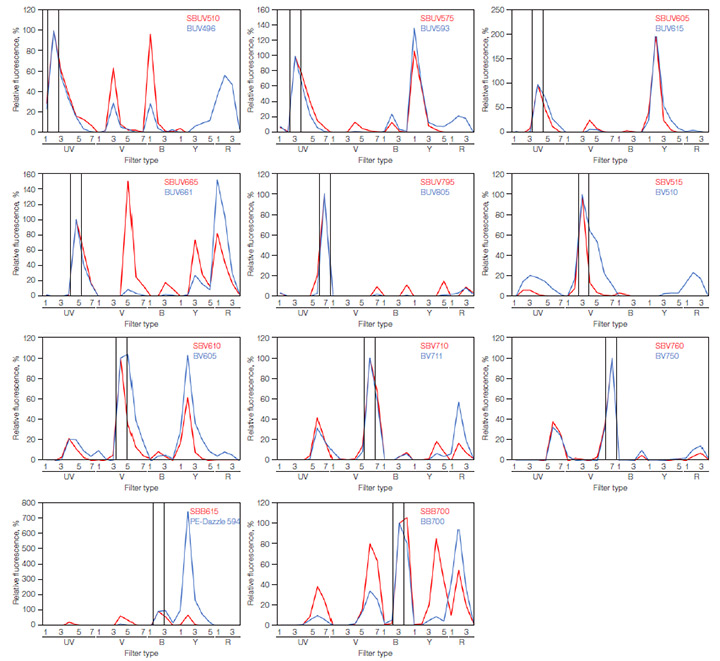
Fig. 1. ZE5 Cell Analyzer spectral profiles of fluorophores used in the panels. Red cell–lysed human peripheral blood was stained with anti-human CD4 conjugated to various fluorophores. Cells were gated on the live, single-cell CD4+ population, determining the signal in each filter. SBB615 was compared to PE-Dazzle 594, as it was the only alternative 488 nm excitable dye emitting at a similar wavelength. The filters have been arranged by laser order along the x-axis, with the target filter highlighted in black. The y-axis shows the amount of signal in each filter normalized to the target filter. UV, ultraviolet (355 nm) laser; V, violet (405 nm) laser; B, blue (488 nm) laser; Y, yellow (561 nm) laser; R, red (640 nm) laser. BB, Brilliant Blue; BUV, Brilliant UltraViolet; BV, Brilliant Violet; SBB, StarBright Blue; SBUV, StarBright UltraViolet; SBV, StarBright Violet.
The fluorophores used in the panels have unique spectra with different amounts of spillover. SBV760 and BV750 are most similar, with BV750 having just a small increase in spillover into filter 4 off the 488 nm laser (B4) and filters 2 and 3 off the 640 nm laser (R2 and R3). A large difference is observed between SBB700 and BB700: they have the same peak signal in their target filter, filter 3 off the 488 nm laser (B3), with the StarBright Dye having a greater signal in some of the UV (355 nm), V (405 nm), and Y (561nm) filters, but less in the R (640 nm) filters.
17-Color Immunophenotyping Panels
The same gating strategy was used for both panels to identify multiple populations in human peripheral blood. Major cell types, including T cells, B cells, and monocytes, were identified. Subpopulations, including effector memory (EM) and central memory (CM) CD4+ and CD8+ T cells, could also be identified. Figure 2 shows data from the StarBright Dye panel, and Figure 3 from the comparison panel.
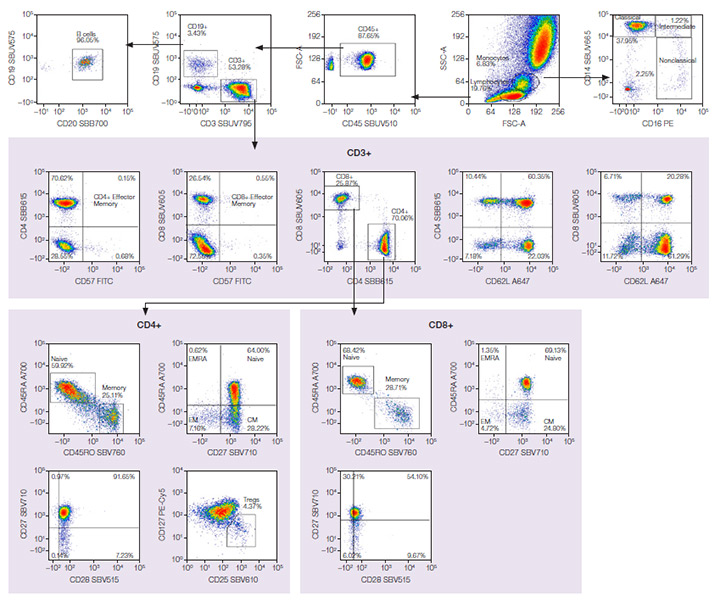
Fig. 2. StarBright Dye panel. Red cell–lysed human peripheral blood stained with a 17-color antibody panel in PBS + 1% BSA, including a live/dead dye. EM, effector memory; CM, central memory. Axxx, Alexa Fluor; BB, Brilliant Blue; BUV, Brilliant UltraViolet; BV, Brilliant Violet; FITC, fluorescein isothiocyanate; PE, phycoerythrin; PE-Cy5, phycoerythrin-cyanine5; SBB, StarBright Blue; SBUV, StarBright UltraViolet; SBV, StarBright Violet.
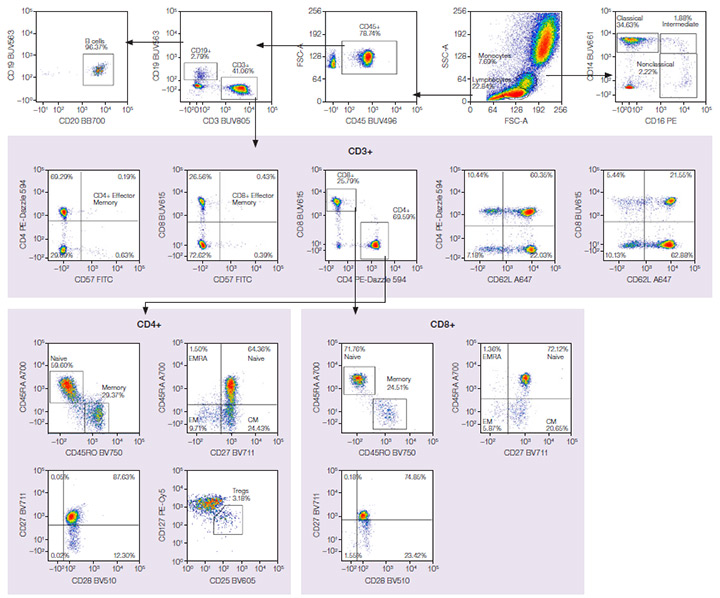
Fig. 3. Comparison fluorophore panel. Red cell–lysed human peripheral blood was stained with a 17-color antibody panel in BD Horizon Brilliant Stain Buffer, including a live/dead dye. EM, effector memory; CM, central memory. Axxx, Alexa Fluor; BB, Brilliant Blue; BUV, Brilliant UltraViolet; BV, Brilliant Violet; FITC, fluorescein isothiocyanate; PE, phycoerythrin; PE-Cy5, phycoerythrin-cyanine5; SBB, StarBright Blue; SBUV, StarBright UltraViolet; SBV, StarBright Violet.
Panel Comparisons
Spillover (Suppl. Tables 1 and 2) and spreading (Suppl. Tables 3 and 4) matrices were generated for each panel. The StarBright Dye panel had lower overall spillover values, with a sum of 47 compared to 53 for the comparison panel. It also gave lower overall spreading, with a sum of 218 compared to 314. Lower values indicate there is less spillover and spreading between the fluorophores in the panel as a whole and can be an indicator of better cell resolution.
In most cases, the StarBright Dyes were brighter than the comparison fluorophore of similar excitation and emission wavelength. The brightness of some of the fluorophore pairs can be seen in Figure 4, where for example, you can see SBUV665 is much brighter than BUV661.
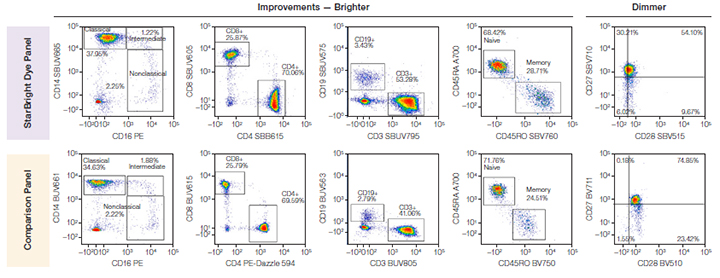
Fig. 4. Comparison of brightness of fluorophores with similar excitation and emission wavelengths in both panels. In most cases, StarBright Dyes were brighter than fluorophores used in the comparison panel. A700, Alexa Fluor 700; BUV, Brilliant UltraViolet; BV, Brilliant Violet; PE, phycoerythrin; SBB, StarBright Blue; SBUV, StarBright UltraViolet; SBV, StarBright Violet.
Conclusions
Comparative analysis of the two panels and the spectral profiles of similar fluorophores revealed that StarBright Dyes can improve the results of multicolor assays.
Many differences were seen between the spectral profiles of the StarBright Dyes and the alternative fluorophores. When designing panels, spectral profiles should be taken into consideration to minimize spillover and spread. On the ZE5 Cell Analyzer, all the fluorophores were excited to varying degrees by more than one laser with the exception of BUV805, which gave a signal only in filters off the 355 nm laser. For some of the fluorophore pairs, the StarBright Dyes showed less spillover than the comparison fluorophores; however, the opposite was true in other fluorophore pairs. Note that due to the difference in spectral profiles of these fluorophore pairs, with the exception of SBUV605/BUV615 and SBV760/BV750 pairs, they can be used in the same spectral cytometry experiment, as they can be unmixed, allowing for the expansion of spectral panels.
Due to the mixed results between the StarBright Dyes and alternative fluorophores, evaluating and comparing how they perform in a panel was crucial.
Two 17-color panels were successfully designed to identify major lymphocyte and monocyte populations, as well as subpopulations. This included helper T cells, cytotoxic T cells, and regulatory T cells, in addition to classical, intermediate, and nonclassical monocytes. The data were probed further to identify any differences in the panels, showing improved performance in the StarBright Dye panel.
Generally, the StarBright Dye panel exhibited the following:
Brighter Signals
Antibodies conjugated to StarBright Dyes exhibit increased or comparable brightness versus comparison fluorophores. The one exception to this trend was SBV515, which resulted in clearer separation and identification of populations.
Less Compensation
There was an overall reduction in the amount of compensation required for antibodies conjugated to StarBright Dyes.
- The greatest reduction in compensation observed was in filters off the 640 nm laser, where A647 and A700 are detected. For example, the compensation value between BUV661 and A700 was more than double the value between SBUV665 and A700
- There was also a small reduction in compensation required for the StarBright Dye panel for both SBUV605 with PE and PE-Cy5 and SBV610 with PE and PE-Cy5 compared to the alternative fluorophores, BUV615 and BV605
Less Spreading
There was an overall reduction in the spreading in the StarBright Dye panel. Reduced spreading improves population resolution and gating accuracy.
- The most significant reduction was in the filters off the 640 nm laser
- There was also a reduction in the amount of spread into the 561 nm excitable dyes, PE and PE-Cy5
As well as improving multicolor assay results, there are other benefits when incorporating StarBright Dyes into your panels of any size. For example, no special buffer is required. The StarBright Dye panel was stained in PBS + 1% BSA, whereas the comparison panel required staining in BD Horizon Brilliant Stain Buffer to prevent the interaction of BUV and BV fluorophores.
Find out more about the full range of antibodies conjugated to StarBright Dyes and their benefits, and access handy Bio-Rad resources including Stain Index Guides, the Multicolor Panel Builder, and the Fluorescence Spectraviewer.
Appendix
Suppl. Table 1. Spillover matrix for the StarBright Dye panel. Values represent the amount of spillover for each fluorophore. The rows show the fluorophore, whereas the columns show the detector the signal is collected in. Colors progress from green to white to red as more spillover is present, with green indicating no or very low spillover and red indicating more spillover between the two fluorophores.

Axxx, Alexa Fluor; BB, Brilliant Blue; BUV, Brilliant UltraViolet; BV, Brilliant Violet; FITC, fluorescein isothiocyanate; PE, phycoerythrin; PE-Cy5, phycoerythrin-cyanine5; SBB, StarBright Blue; SBUV, StarBright UltraViolet; SBV, StarBright Violet.
Suppl. Table 2. Spillover matrix for the alternative fluorophore panel. Values represent the amount of spillover for each fluorophore. The rows show the fluorophore, whereas the columns show the detector the signal is collected in. Colors progress from green to white to red as more spillover is present, with green indicating no or very low spillover and red indicating more spillover between the two fluorophores.

Axxx, Alexa Fluor; BB, Brilliant Blue; BUV, Brilliant UltraViolet; BV, Brilliant Violet; FITC, fluorescein isothiocyanate; PE, phycoerythrin; PE-Cy5, phycoerythrin-cyanine5; SBB, StarBright Blue; SBUV, StarBright UltraViolet; SBV, StarBright Violet.
Suppl. Table 3. Spreading matrix for the StarBright Dye panel. Values indicate the amount of spillover spreading (SS) for each fluorophore into all the detectors. The rows show the fluorophore donated SS, whereas the columns show the detector-collected SS. Colors progress from green to white to red as more spreading is present, with green indicating no or very low spreading and red indicating more spreading. The last column depicts the total spread of each fluorophore, with the higher values indicating a greater spread in the panel.

Axxx, Alexa Fluor; BB, Brilliant Blue; BUV, Brilliant UltraViolet; BV, Brilliant Violet; FITC, fluorescein isothiocyanate; PE, phycoerythrin; PE-Cy5, phycoerythrin-cyanine5; SBB, StarBright Blue; SBUV, StarBright UltraViolet; SBV, StarBright Violet.
Suppl. Table 4. Spreading matrix for the alternative fluorophore panel. Values indicate the amount of spillover spreading (SS) for each fluorophore into all the detectors. The rows show the fluorophore donated SS, whereas the columns show the detector-collected SS. Colors progress from green to white to red as more spreading is present, with green indicating no or very low spreading and red indicating more spreading. The last column depicts the total spread of each fluorophore, with the higher values indicating a greater spread in the panel.

Axxx, Alexa Fluor; BB, Brilliant Blue; BUV, Brilliant UltraViolet; BV, Brilliant Violet; FITC, fluorescein isothiocyanate; PE, phycoerythrin; PE-Cy5, phycoerythrin-cyanine5; SBB, StarBright Blue; SBUV, StarBright UltraViolet; SBV, StarBright Violet
.
