Technical Note: Incorporating StarBright Dye–Conjugated Antibodies on the ZE5 Cell Analyzer

- On This Page
- Introduction
- Materials and Methods
- Results
- Conclusion
- Appendix
- Resources
High-Resolution Human Immunophenotyping Panel Incorporating StarBright™ Dye–Conjugated Antibodies on the ZE5 Cell Analyzer
 High-Resolution Human Immunophenotyping Panel Incorporating StarBright Dye–Conjugated Antibodies on the ZE5 Cell Analyzer
Flow cytometry is a powerful technique for collecting vast amounts of information from a single sample. As scientists face increasing research demands seeking answers to complex biological questions, flow cytometry panels have progressively increased in size.
To achieve high-resolution data from large panels, the panels must be well-designed, with antibodies against markers of interest conjugated to high-quality fluorophores. StarBright Dyes are bright fluorescent dyes with reduced spillover and are ideal for all flow cytometry experiments, regardless of panel size and protocol. Here, using the five-laser (5-L) ZE5 Cell Analyzer flow cytometer from Bio-Rad, we tested StarBright Dyes alongside traditional fluorescent dyes in a large panel.
All the instrument’s 27 fluorescence channels were utilized, allowing for the simultaneous detection of 27 distinct markers and identification of numerous human peripheral blood subsets. Exceptional-quality data with high resolution of cell populations were obtained in standard and high-throughput mode.
Introduction
Over the last decade, flow cytometry has become more powerful, gaining the ability to answer increasingly complex biological questions due to the number of antigens and cellular functions that can be measured in a single sample. This increased utility has resulted from advances in cytometer technology and the development of novel fluorophores that facilitate larger panels.
The StarBright Dye range from Bio-Rad includes fluorophores across all five common laser lines: StarBright UltraViolet (SBUV), StarBright Violet (SBV), StarBright Blue (SBB), StarBright Yellow
(SBY), and StarBright Red (SBR) Dyes. StarBright Dyes are conjugated to validated and highly cited antibody clones, exhibit narrow excitation and emission profiles, and work in all buffers. The benefits of these properties are demonstrated here in a panel that includes 22 StarBright Dyes and reveals their suitability for multiplexing.
The ZE5 Cell Analyzer has many features that make this cytometer ideal for immunophenotyping. These features include up to five high-quality, liquid-cooled lasers and superior optics designed for optimal detection of fluorophores in each laser line. The analyzer can detect up to 27 fluorescence parameters and features a high-throughput mode, where wells are sampled continuously and acquired at a faster rate, allowing for rapid sampling even during complex immunophenotyping assays.
Materials and Methods
Staining Protocol
Human peripheral blood was first treated with Red Cell Lysing Buffer (Bio-Rad Laboratories, Inc., catalog BUF04) to remove red blood cells. The blood samples were then blocked in 10% human serum (Sigma-Aldrich, H4522) for 5 min at room temperature (RT), followed by incubation at RT for 1 hr with fluorescent dye–conjugated monoclonal antibodies, shown in Table 1. Following incubation, samples were washed three times in phosphate buffered saline (PBS) + 1% bovine serum albumin (PBS/BSA)(BSA, the Merck Group, A7906) and resuspended in 200 μl (for standard-mode acquisition) or 25 μl (for high-throughput acquisition) of PBS/BSA. Propidium iodide (PI) was added 5 min before acquisition.
For compensation controls, cells were incubated with a single antibody except in the case of antibodies conjugated to SBUV665, BUV421, SBV440, FITC, SBY720, A647, and A700, where UltraComp eBeads Compensation Beads (Thermo Fisher Scientific Inc., 01-2222-41) were used. All antibodies were titrated before use and utilized at the optimal dilution.
Panel Design
Bio-Rad’s Multicolor Panel Builder and Fluorescence Spectraviewer tools assisted with fluorophore selection in this complex panel. Best practices were followed to generate high-quality data:
- Specific markers were selected that allowed the biological question to be answered. As the experimental aim was to identify major cell subsets in human peripheral blood, the appropriate markers to detect the major T-cell, B-cell, monocyte, and granulocyte lineages were identified
- The flow cytometer configuration was identified to determine which fluorophores could be detected. The 5-L ZE5 Cell Analyzer with 7 detectors off UV option A (Bio-Rad, 12014135) was used. Bio-Rad’s Multicolor Panel Builder, used in conjunction with the Multicolor Panel Building Poster, identified appropriate fluorophores based on the optimal laser excitation and emission wavelength
- Where possible, bright fluorophores were paired with markers with a low antigen density. For example, less abundant CD24 was detected with an antibody conjugated to SBV440 (having a relative brightness of 5). Conversely, dim fluorophores were paired with markers with a high antigen density where possible. For example, the more abundant CD8 was detected with an antibody conjugated to SBR815 (having a relative brightness of 3)
- Fluorophore spillover and spread were considered to reduce spreading effects that could complicate analysis. As high spread can make it difficult to identify cells correctly, high-spreading fluorophore pairs were used on mutually exclusive markers (markers not detecting the same cell types). For example, SBR815 was used for CD8 on T cells, whereas SBR775 was used for CD19 on B cells. Additionally, as spreading effects are greater with a brighter signal, this impact was minimized by using a dimmer fluorophore, SBY665 (with a relative brightness of 3) with CD45, which is expressed on all cells of interest
- Rare cells were detected with antibodies conjugated to bright fluorophores. For example, an antibody conjugated to BV421 (with a relative fluorescence of 5) was used to identify less frequent CD56-positive natural killer cells
- A high-quality sample was used. Human peripheral blood was stained the same day the blood was drawn to avoid a high number of dead cells, which can give false positives. Additionally, PI, a live/dead dye, was included to gate out any dead cells that were in the sample during analysis
The list of antibodies and live/dead dye used in the panel are shown in Table 1.
Table 1. Reagents used. Antibodies and live/dead dye used in the multiplex panel.
Target |
ZE5 Cell Analyzer |
Fluorophore |
Antibody |
|---|---|---|---|
|
HLA DP DQ DR |
355: 387/11 |
SBUV400 |
|
|
CD20 |
355: 509/24 |
SBUV510 |
|
|
CD33 |
355: 577/15 |
SBUV575 |
|
|
Live/dead dye |
355: 615/24 |
PI |
|
|
CD163 |
355: 670/30 |
SBUV665 |
Coming soon |
|
CD28 |
355: 747/33 |
SBUV740 |
|
|
CD62L |
355: 780LP |
SBUV795 |
|
|
CD56 |
405: 420/10 |
BV421 |
318327 (Biolegend) |
|
CD24 |
405: 460/22 |
SBV440 |
Coming soon |
|
CD45RA |
405: 525/50 |
SBV515 |
|
|
CD45RO |
405: 615/24 |
SBV610 |
|
|
CD40 |
405: 670/30 |
SBV670 |
Coming soon |
|
CD2 |
405: 720/50 |
SBV710 |
|
|
CD14 |
405: 750LP |
SBV790 |
|
|
CD57 |
488: 525/35 |
FITC |
MCA1305F** |
|
CD3 |
488: 593/52 |
SBB580 |
|
|
CD11b |
488: 692/80 |
SBB700 |
|
|
HLA ABC |
488: 750LP |
SBB810 |
|
|
CD10 |
561: 583/30 |
SBY575 |
|
|
CD4 |
561: 615/24 |
SBY605 |
|
|
CD45 |
561: 670/30 |
SBY665 |
|
|
CD27 |
561: 720/60 |
SBY720 |
|
|
CD38 |
561: 750/LP |
SBY800 |
|
|
CD16 |
640: 670/30 |
A647 |
|
|
CD31 |
640: 720/60 |
A700 |
|
|
CD19 |
640: 775/50 |
SBR775 |
|
|
CD8 |
640: 800LP |
SBR815 |
Coming soon |
* Antibodies are from Bio-Rad unless otherwise marked.
** Not currently available for purchase. See MCA1305GA for purified format. Axxx, Alexa Fluor; BV421, Brilliant Violet 421; FITC, fluorescein isothiocyanate; PI, propidium iodide; SBB, StarBright Blue; SBR, StarBright Red; SBUV, StarBright UltraViolet; SBV, StarBright Violet; SBY, StarBright Yellow.
Data Collection
Samples were acquired on a 5-L ZE5 Cell Analyzer with the UV option A, 355 nm laser upgrade. In standard mode, 300,000 cells were acquired for the multiplex panel and 60,000 for the single-stained controls at a 1 µl/sec rate. For fully stained samples acquired in high-throughput mode, 15 µl sample volumes were acquired at 2 µl/sec.
Gating Strategy
Analysis was performed using FCS Express 7 Software (De Novo Software by Dotmatics). Dead cells were first excluded from downstream analysis by gating on PI-negative cells. Doublet discrimination was used to identify single cells, followed by gating on CD45+ cells. Lymphocytes, monocytes, and granulocytes — the three major cell populations — were identified based on forward scatter area (FSC-A) and side scatter area (SSC-A) gating (Figure 1). CD3+ and CD3– cells were then identified. These populations were used for downstream gating strategies to identify subpopulations as shown in Figures 2–5.
Results
An immunophenotyping panel was successfully acquired without the use of a special buffer. Major T-cell, B-cell, monocyte, and granulocyte lineages were identified. Various subsets within these lineages were also clearly distinguished. Data in Figures 1–5 were from cells acquired on the ZE5 Cell Analyzer in standard acquisition mode. The spillover and spreading matrices are shown in the Appendix (Supplementary Tables 1 and 2).
Basic Gating
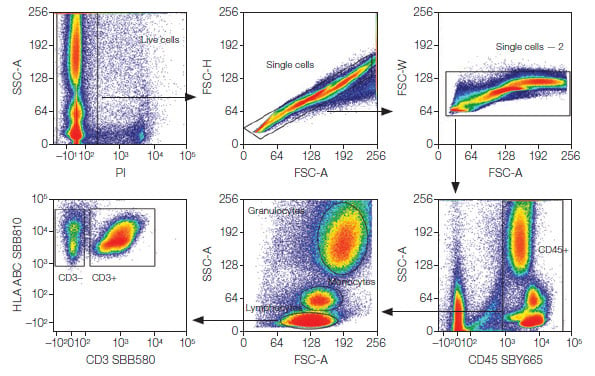
Fig. 1. Basic gating strategy. Major lymphocyte (CD3+ and CD3–), monocyte, and granulocyte populations were identified after gating on live, single CD45+ cells. PI, propidium iodide; SBB, StarBright Blue; SBY, StarBright Yellow; FSC-A, forward scatter area; SSC-A, side scatter area.
T-Cell (CD3+) Gating
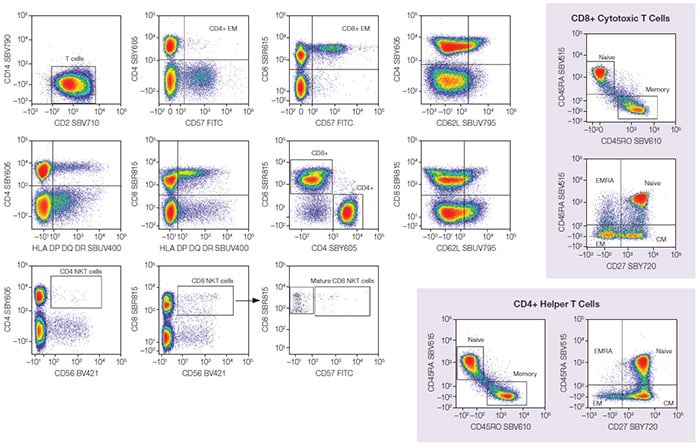
Fig. 2. T-cell populations. CD3+ lymphocytes were further analyzed to identify T-cell populations, including NKT and CD4+/CD8+ T cells with different memory statuses. CM, central memory; EM, effector memory; EMRA, terminally differentiated effector memory T cells re-expressing CD45RA; NKT, natural killer T cells; BV421, Brilliant Violet 421; FITC, fluorescein isothiocyanate; SBB, StarBright Blue; SBR, StarBright Red; SBUV, StarBright UltraViolet; SBV, StarBright Violet; SBY, StarBright Yellow.
CD3– Lymphocytes
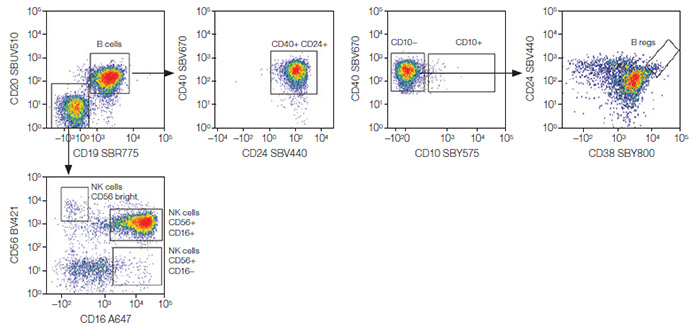
Fig. 3. CD3– lymphocytes. NK and B-cell populations were identified from the CD3– lymphocytes. B regs, regulatory B cells; NK, natural killer cells; A647, Alexa Fluor 647; BV421, Brilliant Violet 421; SBR, StarBright Red; SBUV, StarBright UltraViolet; SBV, StarBright Violet; SBY, StarBright Yellow.
Monocytes

Fig. 4. Monocytes. Classical, intermediate, and nonclassical monocyte subpopulations were identified from the monocytes. A647, Alexa Fluor 647; SBB, StarBright Blue; SBUV, StarBright UltraViolet; SBV, StarBright Violet.
Granulocytes
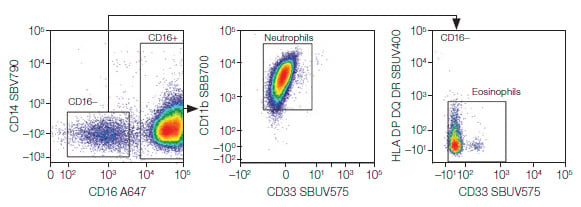
Fig. 5. Granulocytes. Neutrophils and eosinophils were identified from the granulocytes. A647, Alexa Fluor 647; SBB, StarBright Blue; SBUV, StarBright UltraViolet; SBV, StarBright Violet.
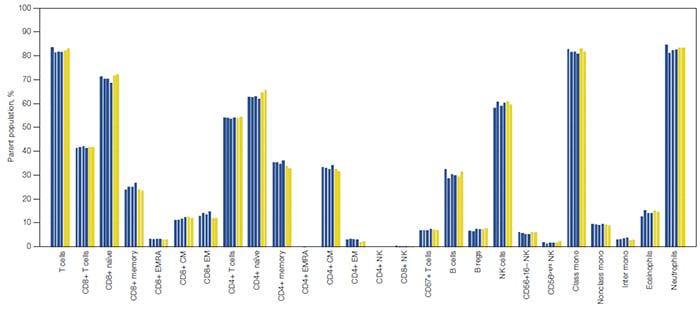
Fig. 6. Comparison of data acquired in standard and high-throughput mode on the ZE5 Cell Analyzer. Cell lineages are expressed as a percentage of their parent cell population. Each bar represents an individual replicate collected in high-throughput mode (
■
) and standard mode (
■
). B regs, regulatory B cells; class mono, classical monocytes; CM, central memory T cells; EM, effector memory T cells; EMRA, terminally differentiated effector memory T cells re-expressing CD45RA; inter mono, intermediate monocytes; NK, natural killer cells; NKT, natural killer T cells; nonclass mono, nonclassical monocytes.
Fully stained samples were also acquired in high-throughput mode with the same compensation matrix applied. Five samples were acquired in approximately 8 seconds per sample, and data were consistent to that acquired in standard mode (Figure 6).
Conclusions
A large 27-color immunophenotyping panel was successfully designed. The panel identified multiple cell populations present in human peripheral blood. In addition, high-quality data from the ZE5 Cell Analyzer was produced using standard or high-throughput mode with few variations between the two. Major observations included:
- High cell resolution — all populations were clearly identified
- Bright signals — all the antibodies with a bimodal signal (distinct positive and negative populations) exhibited clear separation between the 2 populations
- No special buffer requirement for multiplexing StarBright Dyes — some polymer dyes require a special buffer when multiplexing to avoid interactions. StarBright Dyes work in these special buffers, but staining can also be performed in a basic staining buffer (here, PBS + 1% BSA) without interactions
- Low spillover and spread values — the use of StarBright Dyes (designed to have reduced signal in parts of the spectrum outside the target filter) resulted in low compensation values for a panel of this size. The highest compensation and spread values were from PI. As PI-positive cells were excluded in the first analysis step, this potential interference had a negligible impact on the cell resolution. The highest compensation and spread values between fluorophore pairs were between SBR815 and SBR775. As these values were anticipated at the panel design stage, these fluorophores were used for markers on mutually exclusive cells to minimize effects on the panel
- Reproducible data at speed — results in high-throughput mode showed little difference to those in standard mode across all measured populations, demonstrating that the ZE5 Cell Analyzer can acquire complex immunophenotyping data rapidly and accurately
StarBright Dyes are an ideal choice in multiplexing panels, as demonstrated on the ZE5 Cell Analyzer in both normal and high-throughput acquisition modes.
Appendix
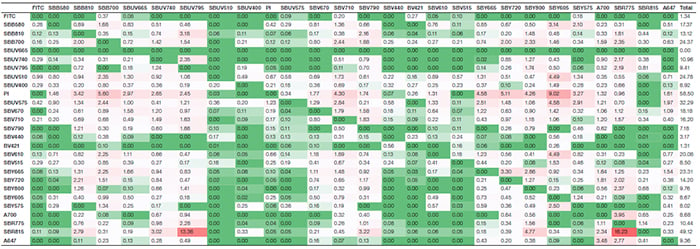
Suppl. Table 1. Spillover matrix. Values represent the amount of spillover for each fluorophore. The rows show the fluorophore, whereas the columns display the detector the signal was collected in. Colors progress from green to white to red as more spillover is present. Green indicates no or very low spillover between the two fluorophores; red indicates more spillover is present. Axxx, Alexa Fluor; BV421, Brilliant Violet 421; FITC, fluorescein isothiocyanate; PI, propidium iodide; SBB, StarBright Blue; SBR, StarBright Red; SBUV, StarBright UltraViolet; SBV, StarBright Violet; SBY, StarBright Yellow.
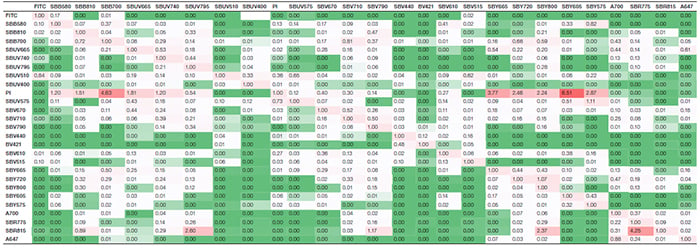
Suppl. Table 2. Spreading matrix. Values indicate the spillover spreading (SS) amount for each fluorophore into all detectors. The rows show the fluorophore-donated SS, whereas the columns display the detector-collected SS. Colors progress from green to white to red as more spreading is present. Green indicates no or very low spreading; red indicates more spreading. Axxx, Alexa Fluor; BV421, Brilliant Violet 421; FITC, fluorescein isothiocyanate; PI, propidium iodide; SBB, StarBright Blue; SBR, StarBright Red; SBUV, StarBright UltraViolet; SBV, StarBright Violet; SBY, StarBright Yellow.


