Apoptosis: Analysis of Apoptosis by Imaging


Overview
Researchers require ways to specifically detect the onset of apoptosis at the earliest opportunity to accurately determine the cause. This is particularly important in cancer research where a resistance to normal apoptotic influence is defined as a “Hallmark of Cancer”. Three imaging based techniques (live cell imaging, immunofluorescence (IF)/immunocytochemistry (ICC) and immunohistochemistry (IHC)) present the ability to gather useful information about apoptosis through visualization of key proteins. Here we will provide general information on each of these techniques and examine how they can be used to detect apoptosis at specific points in the process.
Live Cell Imaging
Live cell imaging is the study of living cells using either phase contrast microscopy or fluorescence microscopy. Phase contrast microscopy has been used to observe the gross morphological changes associated with apoptosis such as cell shrinkage or membrane blebbing. It can even be used to differentiate between apoptosis and another type of cell death, necrosis. The cytoplasm of necrotic cells swells and does not blebb in contrast to apoptotic cells which shrink and blebb.
Several apoptosis assays are compatible with live cell fluorescence microscopy.
One such assay is pSIVA™ REAL-TIME Apoptosis Fluorescent Microscopy Kit. It allows real time analysis of one of the earliest measureable events in apoptotic signaling, the exposure of phophatidylserine (PS) at the cell surface. The pSIVA probe is a biosensor conjugated to the green emitting IANBD dye (excitation maximum 488 nm, emission maximum 530 nm) and only fluoresces when bound to PS in the presence of Ca2+. The method thereby allows the analysis of kinetic apoptosis events in real time by live cell imaging.
The biggest technical challenge, when performing live-cell imaging, is to find the right conditions to maintain cells in a healthy state and functioning normally on the microscope stage, while being illuminated in the presence of synthetic fluorophores and/or fluorescent proteins. Conditions such as temperature, oxygen, carbon dioxide levels, pH and osmolarity of the culture medium will be crucial and will need to be optimized for your particular experiment.
IF/ICC
Providing spatial information on apoptotic protein expression, IF is commonly used in the study of apoptosis. The staining protocol for IF experiments will depend on whether the chosen cell line is adherent or non-adherent. Adherent cells should be grown, treated, fixed and stained directly in multi-well plates, chamber slides or on coverslips. Non-adherent cells require different handling and can be stained according to a non-adherent cell IF protocol.
Control experiments must be included to validate IF experiments. These include staining cells with only the secondary antibody to ensure that staining is specific. Best results are achieved by optimizing the concentration of counterstains, primary and secondary antibodies, as well as fixation, blocking and washing steps. When selecting an antibody for IF there are three primary considerations.
- Select an antibody designed and validated for use in IF. To help with this selection, Bio-Rad provides a list of all IF validated antibodies
- Using a primary labeled antibody may not necessarily provide sufficient signal to detect the target protein. In this case it may be appropriate to use a secondary antibody, particularly a polyclonal, which may bind to several sites on the primary antibody thus giving a stronger signal. To find a complete list of IF validated secondary antibodies, visit our dedicated IF secondary antibody page. If staining is too high or non-specific, utilizing the correct blocking agent may help reduce non-specific antibody binding
- Select a fluorophore of sufficient brightness and stability that is compatible with your instrument. For example APC and Alexa Fluor 647 have similar excitation and emission spectra. However APC is a poor choice in IF as it is prone to photo-bleaching. For advice on fluorophore selection, refer to our fluorophore guide
IHC
In tissue samples IHC is commonly used to show the presence of apoptotic cells in situ. Depending on how the tissue has been prepared, the IHC technique is referred to as IHC-paraffin (IHC-P) or IHC-frozen (IHC-F). Our antibody protocols page provides specific protocols for handling both IHC-F and IHC-P prepared tissues. For help with optimizing IHC experiments, refer to our dedicated IHC application page. It includes protocols, tips and hints and links to antibodies and reagents all specific to IHC. Additionally you can view our popular webinar entitled "Mastering Immunohistochemistry staining experiments".
Bio-Rad offers the ZOETM Fluorescent Cell Imager which eliminates the complexities of cell imaging associated with traditional microscopes. This fluorescence imaging system combines the ease of use of a personal tablet with the power of an inverted microscope.
With these antibody and sample preparation considerations in mind we will now examine how the four phases of apoptosis can be analyzed by imaging techniques.
Induction Phase of Apoptosis
The induction phase of extrinsic apoptosis involves binding of ligands to the “death receptors”. During tumor development cells can escape immune elimination through acquisition of resistance to extrinsic mediated apoptosis. Therefore, determining the role of the cell surface expression of death receptors as well as the prevalence of secreted decoy receptors is crucial. IF/ICC and IHC based detection of the death receptors can provide crucial insight in both cancer cell models and tissue samples. Table 1 lists antibodies validated for IF based analysis of death receptors. Figure 1 shows staining of two cell lines using a polyclonal antibody against CD120b.
Table 1. IF/ICC validated antibodies against receptors of the induction phase of the extrinsic apoptosis pathway.
Receptor |
Synonyms |
Catalog Number |
|---|---|---|
|
DR5 / TRAIL-R2 |
MCA4638T |
|
|
TNF-R2 |
AHP1833 |
Abbreviations: DR5, death receptor 5, TNF-R2, tumor necrosis factor receptor 2; TRAIL-R2, TNF-related apoptosis-inducing ligand receptor 2.
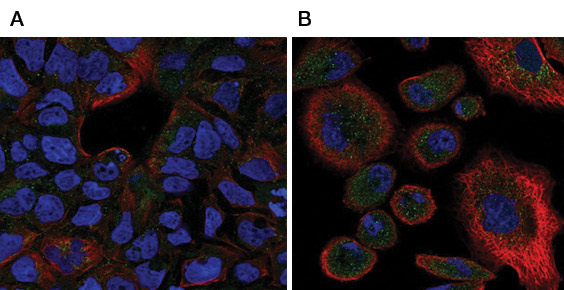
Fig. 1. Staining of two cell lines using a polyclonal antibody against CD120b. A, IF staining of CaCo-2 cells with Rabbit Anti-Human CD120b (AHP1833), green. Counterstained with phalloidin (red) and DAPI (1351303) (nuclei, blue).B, immunofluorescent staining of PC3 cells with Rabbit Anti-Human CD120b (AHP1833), green. Counterstained with actin, red and nuclei, blue.
Early Phase of Apoptosis
Intrinsic pathway
Analysis of early phase of intrinsic apoptosis by IF involves detection of members of the B cell lymphoma-2 (Bcl-2) family of proteins. It is a common and important technique in cancer research. Over expression of Bcl-2 and oncogenes, such as c-myc, have been observed in chronic lymphocytic leukemia. Table 2 shows IF/ICC and IHC validated antibodies against members of the Bcl-2 family.
Table 2. IF or IHC validated antibodies against members of the early phase of the intrinsic apoptosis pathway.
Target |
Synonyms |
Catalog Number |
Further Information |
|---|---|---|---|
|
Bcl-2 oncoprotein |
MCA1550 |
IHC-F and IHC-P validated |
|
|
Bcl-2-associated agonist of cell death
|
AHP2422 |
IF/ICC and IHC-P validated |
|
|
PMAIP1
|
AHP2170 |
E and WB validated |
|
|
p53 upregulated modulator of apoptosis |
AHP2341 / AHP727 |
AHP2341- IF/ICC validated AHP727- IHC-P validated |
Abbreviations: Bcl-2, B-cell lymphoma 2; BID, BH3, interacting-domain death agonist; BAD, Bcl-2-associated death promoter; NOXA, phorbol-12-myristate-13-acetate-induced protein 1; PUMA, p53 upregulated modulator of apoptosis.
Extrinsic pathway
The extrinsic early phase event PS flipping in the cell membrane can be visualized using pSIVA™ Apoptosis Fluorescent Microscopy Kits. These kits allow real time detection of PS flipping (Figure 2) by live cell imaging. pSIVA detection works on the basis that annexin V has a high binding affinity for PS in the presence of calcium and is therefore a common tool for detecting apoptotic cells.
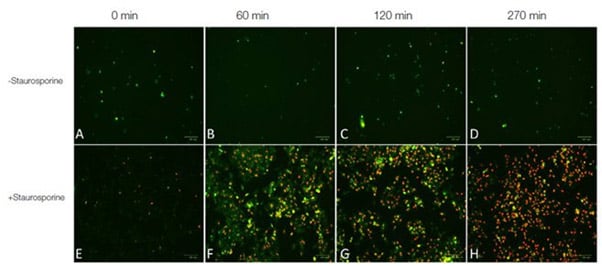
Fig. 2. Real-time apoptosis imaging experiment. E, F, G, H, 1x10⁵ HeLa cells were treated with 1 μM of the apoptosis inducing agent staurosporine or A, B, C, D, left untreated. pSIVA–IANBD+ PI were added to the media according to kit instructions. Cells were imaged post treatment with the ZOE Fluorescent Cell Imager at 0 min, 60 min, 120 min and 270 min. A-H, merged images of the red and green fluorescence channels. Early apoptotic cells were stained with pSIVA-IANBD (in green) while late apoptotic/dead cells were stained with PI (in red).
Caspase-3 and Caspase-7 are responsible for the membrane flipping of PS shown in Figure 2. Caspases inhibit PS flippase which under normal conditions maintains the integrity of the membrane. Both global and individual caspase activity can be measured by fluorescent imaging. Caspase FLICA™ Apoptosis Detection Kits allow immunofluorescent analysis of active caspases in whole, living cells. Their methodology is based on a unique cell-permeable and non-cytotoxic reagent called the Fluorochrome Inhibitor of Caspases (FLICA). The reagent contains a caspase inhibitor sequence (such as VAD) linked to a green (carboxyfluorescein, FAM) or red (sulforhodamine, SR) fluorescent probe. For more information, visit our dedicated Caspase FLICA Apoptosis Detection Kits page. Included in this range is a poly-caspase which is useful in determining if cell death is the result of apoptosis or another form of programmed cell death such as necrosis.
Mid Phase of Apoptosis
 or presence (dying) of staurosporine to induce apoptosis.")
Fig. 3. Jurkat cells were cultured in the absence (healthy) or presence (dying) of staurosporine to induce apoptosis. The cells were stained with TMRE Dye (ICT946). Apoptotic cells with depolarised mitochondria exhibit reduced orange/red fluorescence.
The mid phase of apoptosis sees mitochondrial membrane depolarization, the formation of the apoptosome, caspase-9 activation and subsequent activation of the effector caspases. The apoptosome is a wheel-shaped complex with a sevenfold symmetry consisting of Apaf-1, cytochrome c and caspase-9. While defects in the apoptosome are observed in cancer, overactive apoptosome activity is present in neurodegenerative disease such as Alzheimer’s disease. Therefore assessing the expression of apoptosome components provides useful data on the role of this core apoptotic complex in pathology.
Intrinsic pathway
The mid phase of intrinsic apoptosis consists of mitochondrial membrane disruption, apoptosome formation and caspase-9 activation. Perhaps the most significant of these events is the depolarization of the mitochondrial membrane since it represents an irreversible commitment of cells to apoptosis. MitoPT Kits provide a fluorescent signal that represents the change in membrane potential across the mitochondrial membrane. This process can be imaged using IF. Cells undergoing apoptosis show a reduced fluorescence compared to control cells (Figure 3). This reduced fluorescence is due to the dye no longer being able to accumulate in mitochondria but instead spreading throughout the cell, which dilutes the fluorescent signal. Table 3 lists the IF validated mitochondrial membrane potential kits.
Table 3. IF validated mitochondrial membrane potential kits.
Description |
Format |
Detection Method |
|---|---|---|
|
TMRE Mitochondrial Stain (red fluorescence) |
Non apoptotic cells – bright red Apoptotic cells reduced red fluorescence |
|
|
Mitochondrial Membrane Potential Kit (ICT948) |
TMRM Mitochondrial Stain (red fluorescence) |
Non apoptotic cells – bright red Apoptotic cells reduced red fluorescence |
|
JC-1 Dye (dual green/red fluorescence) |
Non apoptotic cells-red Apoptotic cell -green |
Abbreviations: JC-1, 5,5',6,6'-tetrachloro-1,1',3,3'-tetraethylbenzimidazolylcarbocyanine iodide; TMRE, tetramethylrhodamine ethyl ester; TMRM, tetramethylrhodamine methyl ester.
Following depolarization of the mitochondrial membrane and formation of the apoptosome, the initiator caspase, caspase-9, becomes activated. The activity of caspase-9 can also be determined using IF validated Caspase-9 FLICA Kits.
Table 4. IF kits against members of the mid phase of the intrinsic apoptosis pathway.
Target |
Catalog Number |
Further Information |
|---|---|---|
|
ICT912 / ICT913 / ICT961 |
IF/ICC validated |
Extrinsic pathway
During the mid phase of the extrinsic apoptosis pathway, the effector caspases (caspase-3 and caspase-7) become activated. Activation of this phase can be confirmed in IHC using antibodies against active forms of caspases-3 and 7. Table 5 lists IHC-P validated antibodies against total and activated forms of effector caspases. There are advantages to using antibodies to detect caspase activity compared to kits such as the Caspase FLICA™ Apoptosis Detection Kits. One of them is the variety of the samples that can be used such as fixed human tissue samples. Additionally detecting full length or active caspases with IHC may provide information about the localization of the apoptotic signaling.
Table 5. IHC-P validated antibodies against effector caspases present in the mid phase of the extrinsic apoptosis pathway.
Target |
Synonyms |
Catalog Number |
|---|---|---|
|
CPP32 |
AHP2717 |
Late Phase of Apoptosis
 followed by HRP conjugated Goat anti Mouse IgG, visualized using chemiluminescence.")
Fig. 4. Western blot analysis of Hela whole cell lysate probed with Mouse anti-Human actin beta antibody (MCA5775GA) followed by HRP conjugated Goat anti Mouse IgG, visualized using chemiluminescence.
During the late phase of apoptosis, gross morphological changes in cells become fully observable. This includes cell shrinkage, membrane blebbing, DNA fragmentation and the formation of apoptotic bodies. These changes are observable using simple phase contrast microscopy. However to investigate these processes in more detail, several antibody based methods are available.
Cell shrinkage occurs as a result of the serine/threonine kinase rearranging the cytoskeleton. This physical rearrangement is best visualized by staining for actin, which constitutes the larger part of the cytoskeleton and is cleaved during the late stage apoptosis. Actin can be stained with either an antibody against actin or the toxin phalloidin. Phalloidin only stains for F-actin (filamentous actin) while antibodies against actin target also react with G-actin (globular actin). As a result they may provide a more complete picture of the cytoskeleton during apoptosis. Figure 4 shows western blotting analysis of whole cell lysate with an anti-actin beta antibody (MCA5775GA). Clone 4C2 (MCA5775GA) has also been extensively validated for IF staining and is therefore highly useful for ICC based visualization of actin.
Rho-associated protein kinase (ROCK), DNA fragmentation factor (DFF) 40 and DFF45 mediate cytoskeleton rearrangement and DNA fragmentation in the late phase of intrinsic apoptosis. DFF is a heterodimeric protein of 40 kD (DFFB) and 45 kD (DFFA) subunits. DFFA is the substrate for caspase-3 and triggers DNA fragmentation during apoptosis. DFF becomes activated when DFFA is cleaved by caspase-3. Poly (ADP-Ribose) polymerase-1 (PARP-1) is a DNA repair protein also cleaved by effector caspases and as a result cannot repair the DNA fragmented as part of the apoptotic process. Table 6 lists IHC validated antibodies against DFF40, DFF45, ROCK and PARP-1.
Table 6. IF or IHC validated antibodies against members of the late phase of the apoptosis pathway.
Target |
Synonyms |
Catalog Number |
Further Information |
|---|---|---|---|
|
DFF-A / ICAD |
AHP2459 / AHP484 |
IHC-P validated |
|
|
Rho-associated, coiled-coil-containing protein kinase 1 |
AHP2520 |
IHC-P validated |
|
|
Poly (ADP-Ribose) Polymerase-1 |
MCA1522G |
IHC-P and IHC-F validated |
Abbreviations: CAD, caspase activated DNase; DFF, DNA fragmentation factor; DFF A, DNA fragmentation factor subunit alpha; DFF B, DNA fragmentation factor subunit beta; ICAD, inhibitor of caspase; ROCK, Rho-associated protein kinase, PARP-1, poly (ADP-ribose)
 blocked with 10% FCS and stained with Mouse Anti- Human Cytokeratin 18 (MCA1864H) and detected with Goat Anti-Mouse IgG:A488 (STAR117D488GA). The tissue was also countered with PureBluTM DAPI (1351303).")
Fig. 5. Paraffin section of human colon adenocarcinoma (HIER citrate pH 6 antigen retrieval) blocked with 10% FCS and stained with Mouse Anti- Human Cytokeratin 18 (MCA1864H) and detected with Goat Anti-Mouse IgG:A488 (STAR117D488GA). The tissue was also countered with PureBlu™ DAPI (1351303).
DAPI is a dye that can be used as a tool to visualize nuclear changes and assess apoptosis. DAPI binds strongly and selectively to the minor groove of adenine-thymine regions of DNA. When bound to double-stranded DNA, DAPI absorbs light at 359 nm (ultraviolet light) and emits at 461 nm (fluoresces blue). Bound DAPI has a fluorescence intensity approximately 20 fold higher than that of unbound DAPI. The fluorescence is also directly proportional to the amount of DNA present. As the apoptotic cell membrane is compromised, more DAPI enters the cell and stains a stronger blue color. The differing nuclear morphology of apoptotic cells such as chromosome condensation and fragmentation also helps with visual identification of apoptotic cells stained with DAPI. Additionally, apoptotic cells stained with DAPI may have observable nuclear blebbing which may help in differentiating necrotic cells which do not blebb. Figure 5 shows staining of a human colon adenocarcinoma with an Anti-Cytokeratin 18 Antibody and DAPI. For a full list of DNA binding viability dyes view the cell viability product page.
The number of proteins playing a role in apoptosis is so large that we are not able to detail them all completely. If you cannot find your target protein listed, use our search tool at the top of the page. For more information on imaging based techniques, view our helpful resources listed below.
If you are interested in other applications, Bio-Rad has resources for studying apoptosis by western blot or flow cytometry as well as overviews of the induction, early, mid and late phases of apoptosis.