Apoptosis: Overview
Watch our video describing the various stages of apoptosis and the antibodies and reagents available to study each stage.
Apoptosis
Cell death is a crucial step in organism development, tissue homeostasis and host defence. Apoptosis, a programmed cell death mechanism, is one of the processes by which cells die and evasion of apoptosis is considered a “Hallmark of Cancer”.
Apoptosis proceeds through several stages that are characterized by distinct changes in cell morphology, which can culminate in the engulfment of apoptotic cells by macrophages (Elmore 2007).
In addition to the gross morphological changes there are more subtle molecular changes which can be detected if the correct assay is selected. Detecting these apoptotic events can provide crucial additional information on the pathway by which apoptosis has been initiated.
Four Stages of Apoptosis Schematic
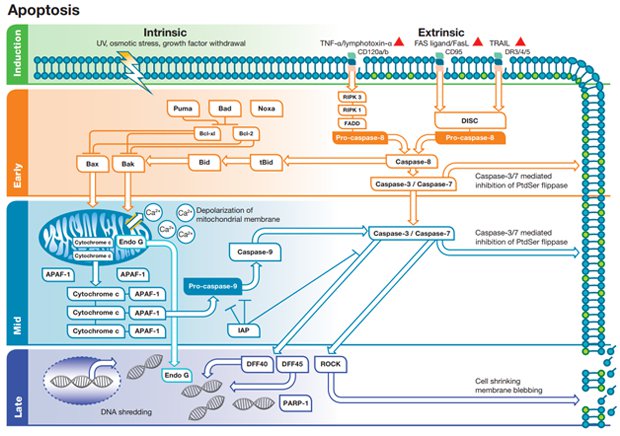
To illustrate these apoptosis events and how to detect them, Bio-Rad has created a pathway which divides apoptosis into four stages: induction, early phase, mid phase and late phase (Figure 1).
Figure 1 is not an exact schematic of apoptotic signaling but merely a useful resource that shows the stages of apoptosis in simplified terms making it easier to discern the process and the methods used to study it.
The pathway also distinguishes between two different types of apoptosis: the intrinsic pathway, mediated by mitochondria in response to internal stimuli such as DNA damage, and the extrinsic pathway, mediated by extracellular death receptors (for example, binding of FasL to CD95).
Download 'Four Stages of Apoptosis Schematic' full image
Fig. 1. Intrinsic and extrinsic apoptosis in four stages. Apoptosis can be induced by several means activating intrinsic or extrinsic pathways. The intrinsic pathway involves the Bcl-2 protein family, mitochondrial permeability and apoptosome formation. The extrinsic pathway involves death receptors, death inducing signaling complex and caspase activation.
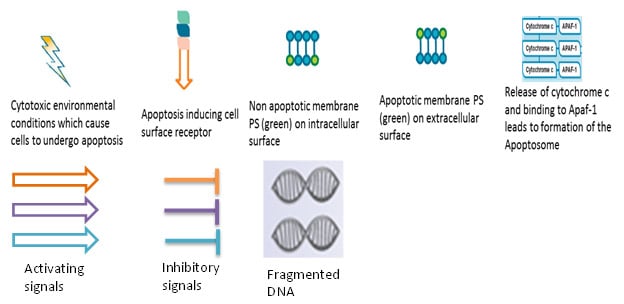
This four stage approach (Figure 1) shows both the intrinsic and extrinsic pathways across three phases (induction, early and mid) and the final late phase where both intrinsic and extrinsic pathways converge. An overview of each step of the pathway is discussed below, however, more detailed information can be found on each step (induction, early phase, mid phase and late phase). For application specific methods, click on the application which best suits your experimental workflow (flow cytometry, western blotting and imaging).
Intrinsic Pathway
Induction phase
Induction of the intrinsic pathway occurs in response to internal pro-apoptotic stimuli such as DNA damage. DNA damage can be induced by a number of external factors represented as a bolt of lightning in Figure 1. These external factors include UV light, osmotic stress and growth factor withdrawal amongst others.
Early phase
Following DNA damage, the B-cell Lymphoma 2 (Bcl-2) family signaling cascades are activated as shown in the early intrinsic phase of Figure 1. DNA damage activates pro-apoptotic members of the Bcl- family (PUMA, Bcl-2-associated agonist of cell death (Bad) and NOXA) leading to inhibition of the anti-apoptotic members Bcl-xL and Bcl-2. Once free of the inhibiting action of Bcl-xL and Bcl-2, Bcl-2 homologous antagonist killer (BAK) and Bcl-2-associated x protein (BAX) are free to insert into the mitochondrial membrane. In the mid stage this will lead to loss of mitochondrial membrane integrity.
Mid phase
The intrinsic pathway is characterized by permeabilization and depolarization of the mitochondrial membrane and is represented in Figure 1 by release of Ca2+ and other factors into the cytoplasm. The loss of mitochondrial membrane integrity is an event which commits the cell irreversibly to apoptosis. Cytochrome c is also released from the compromised mitochondria along with other proteins such as APAF-1. In the cytoplasm, cytochrome c, APAF-1 and pro-caspase-9 form the apoptosome which then leads to activation of caspase-9. Caspase-9 activation instigates activation of the effector caspases (caspase-3/7) and subsequent exposure of phosphatidylserine (PS) to the extracellular side of the cell membrane.
Extrinsic Pathway
The extrinsic pathway is activated by the binding of ligands to members of the tumor necrosis factor receptor super family including CD120a, CD120b, CD95/FAS, Death Receptor (DR) 3, CD261/DR4, CD262/DR5, CD266 and CD358/DR6. Three of the receptors are illustrated in Figure 1 with the corresponding ligand shown above the receptor. The primary apoptosis inducing ligands are TNF-alpha, lymphotoxin-alpha, FasL/CD178 and TNF-related apoptosis-inducing ligand (TRAIL).
Early phase
Following ligand binding to the receptor, signaling pathways are activated leading to formation of signaling complexes such as the Death Inducing Signaling Complex (DISC). Several of the DISC individual components are shown forming downstream CD120a/b while DISC is represented as a single unit beneath CD95/DR3/4/5. The ultimate outcome of the early phase of the extrinsic pathway is the activation of the initiator caspase, caspase-8. Within this phase, there is a potential crosstalk with the intrinsic pathway via caspase-8 mediated activation of BH3-interacting domain death agonist (BID). Full length BID is cleaved by caspase-8 and produces an active 15 kDa fragment which is referred to as truncated BID (tBID).
Mid phase
Caspase-8 activates the effector caspases, caspase-3 and caspase-7 (Figure 1). Caspase-3/7 initiates key apoptotic events such as the exposure of PS to the extracellular side of the cell membrane. It is the point of convergence for the extrinsic and intrinsic apoptotic pathways.
Late Phase of Apoptosis
At this phase of apoptosis, the extrinsic and intrinsic pathways have converged. The late phase begins with activation of caspase-3/7 and results in DNA fragmentation and cell membrane disruption/blebbing (Figure 1). Caspase-3/7 releases DFF40 from its inhibitor DFF45 allowing DFF40 to participate in DNA fragmentation. Endonuclease G released from the mitochondria is also capable of fragmenting DNA. PARP-1 is cleaved by caspase-3 inhibiting the ability of PARP-1 to repair damaged DNA. Caspase-3/7 also activates the serine/threonine kinase ROCK1 by cleavage of the C-terminal inhibitory domain. Active ROCK1 leads to actomyosin-dependent membrane blebbing (Figure 1) as a disruption of the membrane. Late stage apoptosis is characterized morphologically by cell shrinkage and phagocytosis of the apoptotic cell by macrophages.
Caspases
Cysteine aspartic proteases (caspases) play critical roles in regulating inflammation but also other stage of apoptosis. Caspases involved in apoptosis are classified into distinct subsets based on function, effector caspases (caspases-3, -6 and -7) and initiator caspases (caspases-2, -8, -9 and -10). Caspases-1, -4, -5, -11 and -12 are involved in inflammation. All caspases are synthesized in inactive forms, referred to as pro-caspases, that require dimerization/oligomerization and subsequent cleavage for activation. The most common caspases involved in apoptosis are listed in Table 1.
Table 1. Caspases involved in apoptosis.
Caspase |
Activated by |
MW of Human Pro-Caspase (kDa) |
MW of Human Activated Caspase (kDa) |
Examples of Caspase Inhibitors |
|---|---|---|---|---|
|
Apoptosome formation/APAF-1 |
46 |
37 |
LEHD-FMK |
|
|
Caspase-9 |
32 |
17 and 11 |
DEVD-FMK |
|
|
Caspase-9 |
35 |
20 |
DEVD-FMK |
|
|
Caspase-3 |
51 |
12 and 14 |
VDVAD-FMK |
|
|
Caspase-3 |
34 |
15 and 18 |
VEID-FMK |
|
|
Caspase-6/death receptor domain |
56 |
43 and 14 |
LETD-FMK |
|
|
Caspase-6 |
59 |
12 and 43 |
AEVD-FMK |
Abbreviation: MW-Molecular Weight
All caspases are synthesized in inactive forms, referred to as pro-caspases, that require dimerization/oligomerization and cleavage for activation as shown in a simplified diagram (Figure 2).
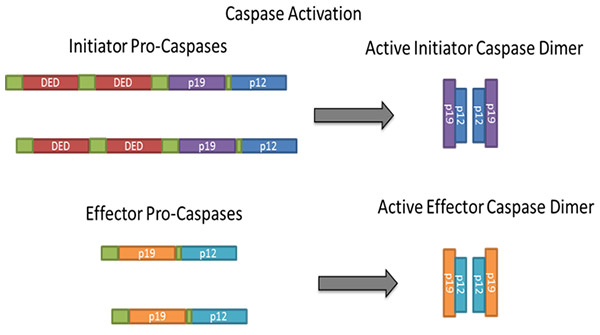
Fig. 2. Dimerization/oligomerization and cleavage of caspases during activation.
Caspase activity can be determined by various experimental methods including western blotting and flow cytometry. Western blot mediated detection of the caspase cleaved (active) fragments requires an antibody targeted to a region of the activated fragment. Additionally caspase activity can be determined by flow cytometry using caspase assays. Their methodology is based on a unique cell-permeable and non-cytotoxic reagent called the Fluorochrome Inhibitor of Caspases (FLICA). The reagent contains a caspase inhibitor sequence linked to a fluorescent probe.
FLICA pass through an intact plasma membrane and covalently bind to the active caspase. Any unbound FLICA diffuses out of the cell and is washed away. The fluorescent signal gives a direct measure of the amount of active caspase in the whole living cell. Bio-Rad offers a complete range of FLICA Caspase Assay Kits.
Initiator caspases
Caspase-8 is an example of initiator caspase and a key signaling molecule in extrinsically mediated apoptosis. Upon activation, the receptor links with the adaptor molecule Fas-associated protein with death domain (FADD) via corresponding death domains (DD). FADD in turn then binds via death effector domains (DEDs) to pro-caspase-8, which then undergoes oligomerization and autocatalytic activation. Active caspase-8 cleaves and activates effector caspases and the Bcl-2 family member (BID) (Wolf & Green 1999).
Effector caspases
Caspase-3 and caspase-7 are examples of so called “effector” caspases. Initiator caspases are cleaved auto-proteolytically whereas effector caspases are cleaved by initiator caspases. This hierarchy allows an amplifying chain reaction. As one might expect effector caspases control the phenotypical changes observed during apoptosis such as membrane blebbing and DNA fragmentation.
In addition to detection of specific initiator and effector caspases, poly caspase kits are also available that recognize all active caspases as can be seen in Figure 3 below.
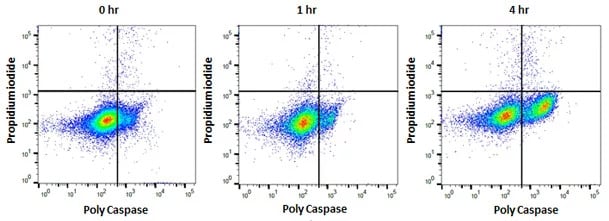
Fig. 3. Jurkat cells treated as shown with staurosporine at 1 µM to induce apoptosis. After apoptosis induction, Jurkat T cells were stained with FAM FLICA Poly Caspase Kit (ICT092) and ReadiDrop™ Propidium Iodide (1351101). Apoptotic cells positive for caspases can be seen in the bottom right quadrant and dead cells positive for both caspase and PI in the top right quadrant. Healthy cells are negative for both stains. Data acquired on the ZE5™ Cell Analyzer.
Analyzing Apoptosis
Table 2 below lists some of the key events within apoptotic signaling and the techniques available to analyze them. Bio-Rad provides a wide selection of apoptosis assays from which you can choose the most appropriate apoptosis detection method for your experiment.
Table 2. Apoptotic events, detection and applications.
Apoptosis Event |
Detection Reagents |
Application |
|---|---|---|
|
Signaling cascades initiated |
Antibody based detection of signaling pathway activation. FLICA Caspase Assay, FLISP Serine Protease Assay |
Flow cytometry, microscopy, western blotting |
|
PS flipping |
Flow cytometry, microscopy |
|
|
TMRM, TMRE, JC-1 |
Flow cytometry, microscopy, microplate reader |
|
|
Cell shrinkage |
Bright field image, F-actin staining |
Flow cytometry, microscopy |
|
Membrane blebbing |
Hematoxylin/eosin |
Microscopy |
|
Nuclear condensation |
Microscopy |
|
|
DNA fragmentation |
TUNEL, Sub-G1 assay, DNA laddering |
Agarose gel, flow cytometry, microscopy |
|
Phagocytosis of apoptotic bodies |
Acridine orange, hematoxylin/eosin |
Flow cytometry, light and electron microscopy |
Abbreviations: FLICA, fluorochrome inhibitor of caspases; PS, Phosaphatidylserine ;pSIVA, polarity-sensitive indicator of viability and apoptosis; MOMP, mitochondrial outer membrane permeabilization; TMRM, tetramethylrhodamine methyl ester; TMRE, tetramethylrhodamine ethyl ester; JC, 1-5,5’,6,6’-tetrachloro-1,1’,3,3’- tetraethylbenzamidazolocarbocyanin iodide; DAPI, 4′,6- diamidin -2- phenylindol ; PI, propidium iodide; 7-AAD, 7-amino-actinomycin D; TUNEL, terminal deoxynucleotidyl transferase dUTP nick end labeling
Selecting and Designing an Apoptosis Assay
No apoptosis assay is complete without all the pieces. While choosing an apoptosis assay may depend on the resources within your laboratory there are several other factors to consider.
High throughput or low throughput
Evaluating the ability to induce apoptosis is an important part of drug development. High throughput is best performed by using flow cytometry based assays. The ZE5 Cell Analyzer, the 5 laser flow cytometer from Bio-Rad, accommodates any sample tube or plate format, from single tubes to 384 well plates. In addition it has the ability to have run speeds of up to 100,000 events per second with no loss in data, perfect for analyzing rare cell events and high throughput analysis.
Experimental model
The nature of the model system chosen to study apoptosis will influence the choice of apoptosis assay. When studying apoptosis in tissue sections, immunohistochemistry is the most appropriate application. When studying apoptosis in an adherent cell line both western blotting and flow cytometry are commonly used. When working with non-adherent cell lines or body fluids, such as peripheral blood, flow cytometry is the most suitable application.
Points of interest within a pathway (intrinsic vs extrinsic)
If examining the apoptotic pathways, you should select an assay which measures apoptosis downstream of your point of interest. For example in the study of BH3 mimetics, you might choose changes in mitochondrial membrane potential as the most appropriate assay, since the effect of BH3 mimetics is likely to activate the intrinsic pathway. On the other hand, in investigations of therapeutic TRAIL agonists, you might select caspase-8 assays or pSIVA Kits since these assays measure the activity of the extrinsic pathway.
Complexity/scope of experiment
Using appropriate controls is a key part of any assay. For example, in flow cytometry based apoptosis, we recommend the inclusion of a viability dye to distinguish the dead cells from those currently in the process of apoptosis. This is the only way to visualize all populations (Figure 4).
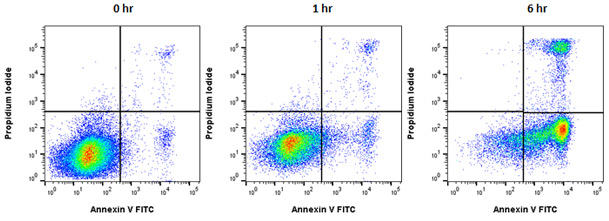
Fig. 4. Annexin V staining to measure apoptosis by flow cytometry. Jurkat T cells were treated as shown with staurosporine at 1
µM to induce apoptosis. The cells were then stained with annexin V FITC (ANNEX100F) and ReadiDrop Propidium Iodide (1351101). Apoptotic cells positive for annexin V can be seen in the bottom right quadrant and dead cells positive for both annexin and PI in the top right quadrant. Healthy cells are negative for both stains. Data acquired on the ZE5 Cell Analyzer.
Annexin V binds to PS on the extracellular surface of the membrane. Propidium Iodide (PI) binds to DNA, but can only enter cells that have a compromised membrane. Live cells with an intact cell membrane will not stain for PI. The cells that are positive for both Annexin V and PI are considered to be dead while those only positive for Annexin V are considered to be undergoing apoptosis (Geske et al. 2000, Van der Mark et al. 2013). These two discrete populations (who would not be identified unless cells were stained with both Annexin V and PI) demonstrate how dead and apoptotic cells can be differentiated. While this is an easy and definitive method for detecting apoptosis it does not provide information on the route by which apoptosis has been induced. Analysis of mitochondrial integrity or determination of caspase-8 activity may provide this additional information.
Phase and Resources
Apoptosis Webinars
Bio-Rad offers hundreds of antibodies suitable for researching apoptosis pathways as well as excellent apoptosis detection kits. All our products are guaranteed to perform to specification and are supported by knowledgeable technical specialists.
References
- Elmore S (2007). Apoptosis: A Review of Programmed Cell Death. Toxicol Pathol. 35, 495-516.
- Geske FJ et al. (2000). DNA repair is activated in early stages of p53-induced apoptosis. Cell Death Differ. 7, 393-401.
- Van der Mark V et al. (2013). P4 ATPases: Flippases in Health and Disease. Int J Mol Sci. 14, 7897-7922.
- Wolf BB and Green DR (1999). Suicidal tendencies: apoptotic cell death by caspase family proteinases. J Biol Chem. 274, 20049-20052.


