DNA Binding for Cell Cycle Products and Resources for Flow Cytometry
- On This Page
- Products
- Protocols
- Resource
s


Intranuclear DNA staining is often used for cell cycle analysis. We provide a range of cell cycle-related antibodies and resources to help your experiments run smoothly.

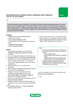
Fig. 1. Overview of the eukaryotic cell cycle. During cell division, cells pass through a series of stages collectively referred to as the cell cycle. To ensure that healthy cells are produced after each round of cell division, the cell cycle consists of three major checkpoints with distinct functions: G1, G2, and Spindle (M) checkpoints.
Products
Cell Proliferation Products
Our range of cell proliferation antibodies comes in a variety of formats and specificities. These antibodies can be used for applications including flow cytometry, western blotting, immunofluorescence, immunohistochemistry, immunoprecipitation, and ELISA.
Please use the buttons/filters to sort the attributes in the table below in order to find the antibody that fits your exact requirements. If you need any further assistance please do not hesitate to contact us. For more information about this field of interest read our eukaryotic cell cycle mini-review.
Our range of cell proliferation products also includes alamarBlue Cell Proliferation and Viability Detection Reagent and proliferation dyes such as CFDA-SE Dyes and CytoTrack Cell Proliferation Assays.
DNA Binding for Cell Cycle Products
| Description | Target | Format | Clone | Applications | Citations | Code |
|---|

Fig. 2. Staining of a mixture of live and heat killed Jurkat cells with ReadiDrop Propidium iodide for 1 min prior to analysis
READIDROP™ Propidium Iodide
Propidium iodide (PI) is a fluorescent dye that binds to DNA and RNA in a stoichiometric ratio. PI is not membrane permeable and therefore requires the compromised membranes of dead cells to bind to DNA. Upon excitation with an appropriate light source, dead cells exhibit higher fluorescence intensity than live cells, thereby enabling clear discrimination of these populations by flow cytometry.
Dead cells can then be excluded from further analysis and also sorted from cell populations of interest. The spectral properties (excitation 535 nm/emission 617 nm) enable use in both single color and multicolor flow experiments.

Fig. 3. Flow cytometry analysis of Jurkat cells heat shocked at 65°C for 5 min and stained with PureBlu DAPI (1351303). Dead cells show positive staining.
PUREBLU™ DAPI
DAPI is a cell permeable fluorescent compound (MW 350.3) that is able to stain the DNA of eukaryotic and prokaryotic cells by binding with high affinity to the minor groove of AT-rich DNA sequences. When DAPI is bound to DNA and excited by an ultraviolet light source, blue fluorescent emission can be detected with maximum emission at 461 nm.
PureBlu DAPI has a characteristic Stokes shift of approximately 100 nm, which makes this dye an optimal choice when good spectral separation is desired. PureBlu DAPI is compatible with fixed and unfixed cells.
Protocols
Immunofluorescence Staining of Cells in Combination with PI Staining of Cells for Cell Cycle Analysis
Immunofluorescence staining of cells in combination with PI staining of cells for cell cycle analysis
This method provides a general procedure for DNA staining for cell cycle analysis using propidium iodide when you need to stain for other intracellular antigens. 70% ethanol is optimal for DNA so if you do not need to stain for other antigens we recommend Protocol FC12 “Propidium iodide staining of cells for cell cycle analysis”. This method will allow you to stain for DNA and cellular antigens, however these are guidelines only and the incubation times may need to be adjusted for different cell types and different antibodies.
Reagents
Phosphate buffered saline (PBS) (BUF036A)
70% ethanol in DI water
2% (w/v) paraformaldehyde in PBS
0.1% saponin (w/v)
1% (w/v) bovine serum albumin in PBS
Nucleic acid staining solution (1x PBS, 100 μg/ml RNAse A)
Methods
- Prepare cells appropriately; refer to protocol FC1. ‘Preparation of cells for flow cytometry’ for further information.
- Fix in 2 ml 2% paraformaldehyde for 30 min on ice.
- Centrifuge at 500 x g for 5 min, decant supernatant.
- Resuspend in 2-5 ml cold (4oC) 70% ethanol. Add drop wise to cell pellet while vortexing. Fix for at least 30 min on ice. Note: specimens can be left at this stage for several weeks.
- Centrifuge at 500 x g for 10 min, decant supernatant.
- Wash twice with 0.1% saponin at 300-400 g at 4oC for 5 min, discard the supernatant.
- Resuspend in 100 ml of 0.1% saponin and add the directly conjugated antibody at the vendor-recommended dilution and incubate for at least 30 min at 4oC, avoiding direct light.
- Wash twice in PBS. Pellet cells at 300-400 g and 4oC for 5 min. Discard supernatant.
- Resuspend in 500 ml nucleic acid staining solution and incubate for 30 min at room temperature avoiding direct light.
- Add propidium iodide e.g. 1-2 drops of ReadiDrop propidium iodide (135-1101).
- Analyze cells by flow cytometry. The propidium iodide should be read on the appropriate channel in the linear scale. Doublets should be gated out using the area vs height or width depending on your instrument.
Notes
Appropriate controls should always be carried out, for flow cytometry the following should be considered for inclusion;
- A known positive sample
- Isotype controls used to determine if the staining is specific
- Unstained cells should always be included in the experimental set-up to monitor autofluorescence
For all multicolor flow cytometry experiments it is advisable to include compensation controls and fluorescence minus one (FMO) controls, which assist with identifying gating boundaries.
Propidium Iodide Staining of Cells for Cell Cycle Analysis
This method provides a general procedure for DNA staining for cell cycle analysis using propidium iodide (PI).
These are guidelines only and the incubation times may need to be adjusted for different cell types.
Reagents
Phosphate buffered saline (PBS) (BUF036A)
70% ethanol in DI water
Nucleic acid staining solution (1x PBS, 100 μg/ml RNAse A)
Methods
- Prepare cells appropriately; refer to protocol FC1. ‘Preparation of cells for flow cytometry’ for further information.
- Fix in 2-5 ml cold (4oC) 70% ethanol. Add drop wise to cell pellet while vortexing. This should ensure fixation of all cells and minimize clumping.
- Fix for at least 30 min on ice. Note: specimens can be left at this stage for several weeks.
- Centrifuge at 500 g for 10 min, decant supernatant.
- Wash twice with 3 ml PBS at 300-400 g and 4oC for 5 min and discard supernatant.
- Resuspend cell pellet in 500 μl nucleic acid staining solution. Mix well.
- Incubate for 30 min at room temperature.
- Add propidium iodide e.g. 1-2 drops of ReadiDrop propidium iodide (135-1101).
- Analyze by flow cytometry. The propidium iodide should be read on the appropriate channel in the linear scale. Doublets should be gated out using the area vs height or width depending on your instrument.
Notes
Appropriate controls should always be carried out, for flow cytometry the following should be considered for inclusion;
- Unstained cells should always be included in the experimental set-up to monitor autofluorescence.
 or Mouse IgG2a Negative Control:FITC (MCA929F) in the absence (A) and presence (B) of Human SeroBlock (BUF070A).")
Fig. 4 BrdU staining for proliferation. Proliferating cells were stained for incorporated BrdU against total DNA content using A. Hoechst or B. Propidium Iodide. BrdU was detected by labeling a mouse primary anti-BrdU antibody (MCA2483) with the appropriate secondary antibody attached to a fluorophore.
Resource
Proliferation and Cell Cycle
Cell proliferation can be measured by flow cytometry using several methods. Whilst simple differences in the forward and side scatter will indicate if there are some changes in the cell cycle more accurate methods are available. One method is to stain with an antibody against a proliferation marker such as Ki67, MCM2, or PCNA. Alternatively you can incubate your cells with BrdU, which incorporates into DNA during S-phase of the cell cycle. Incorporated BrdU can be detected using fluorescently labeled anti BrdU antibodies. When combined with a DNA stain such as PI or DAPI, the relative proportion of cells in S-phase can be determined.
In addition to using antibodies, cytoplasmic dyes, such as CFDA-SE, can be used to measure proliferation. Cells are incubated with the protein binding dyes and as the labeled cells divide, the concentration of the dye is halved and the proliferation measured based upon the reduced levels of fluorescence in subsequent generations. The advantage of these dyes is that they are non-toxic and available in a wide variety of colors, so can be combined with immunophenotyping and do not require the sample to be fixed.
Cell Cycle Determination
The proportion of cells within each stage of the cell cycle can be determined using DNA binding dyes such as PI, 7-AAD, Hoechst 33342, and DAPI that bind in a stoichiometric manner. This way cells in G2, which have twice as much DNA as cells in G1, will fluoresce twice as bright. To ensure good staining the cells should be fixed in cold 70% ethanol. However this can interfere with other staining protocols, see our protocols section for advice on the different methods. Cell cycle analysis is usually measured on a linear scale unlike most flow cytometry which uses a logarithmic scale as the differences in fluorescence are usually smaller. It is important to gate out any doublets from the data and the data can be improved by using a low flow rate on the cytometer. Many flow cytometry software programs now offer algorithms to accurately estimate the cell cycle phases.