Mouse Flow Cytometry Products and Resources

- On This Page
- Products
- Mouse Flow Cytometry Antibodies
- Resources
To aid your experiments, we have collated our mouse-specific products, including Seroblock and our range of mouse antibodies, as well as helpful resources, like our Mouse Cell Marker Selection Tool.
Products

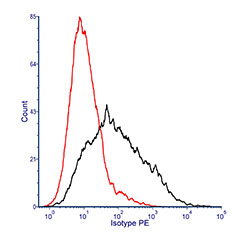
Fig. 1. Mouse bone marrow cells were stained with PE conjugated Rat IgG2b Isotype control (MCA6006PE) in the absence (black histogram) or presence (red histogram) of SeroBlock FcR (BUF041B).
Mouse Seroblock FcR
Mouse Seroblock FcR is a rat antibody that recognizes mouse CD16 and CD32, cell surface proteins also known as FcRγIII and FcRγII, respectively. The function of these proteins is to bind IgG molecules via their Fc regions as part of the adaptive immune response. CD16 and/or CD32 are expressed by a wide variety of cells, including monocytes, macrophages, B lymphocytes, granulocytes, NK cells, dendritic cells, and some activated T lymphocytes
The expression of CD16/CD32 antigens can lead to nonspecific binding of test monoclonal antibodies in staining procedures, resulting in “high background” staining on a wide range of cells. This nonspecific binding may be blocked by preincubation of target cells with Mouse Seroblock FcR, resulting in clearer staining.
Mouse Flow Cytometry Antibodies
| Description | Target | Format | Clone | Applications | Citations | Code |
|---|
Resources

Interactive Mouse Immune Cell Marker Database
Our interactive online tool is easy to use and can help you:
- Look up immune cell-specific markers
- Choose a cell lineage
- Examine detailed data for over 400 markers
- Discover immune cell marker expression
-
Find the antibody to your marker

Fig. 2. Staining mouse lymphocytes. Viable cells were identified by DRAQ7 staining. Mouse peripheral blood was stained with CD4 A488 (MCA2691A488) and CD3 SBV610 (MCA500SBV610) and gated on lymphocytes to identify T cells. Data acquired on the ZE5 Cell Analyzer
Cell Frequencies in Common Samples
Cell frequency can influence the choice of fluorophore and how many cells you will need to collect to obtain statistically significant data, crucial with rare populations.
We have produced a handy table showing the relative frequency of cells in commonly used mouse tissues, allowing you to plan and predict your flow populations.
Murine Cell Frequency
| Spleen | Thymus | Peripheral Blood | Lymph Node | ||||
|---|---|---|---|---|---|---|---|
| Cell Type | Percent | Cell Type | Percent | Cell Type | Percent | Cell Type | Percent |
|
T cells |
21-35 |
CD4+ |
4-6 |
T cells |
17-20 |
T cells |
65-78 |
|
CD4+ |
13-20 |
CD8+ |
1-2 |
CD4+ |
8-12 |
CD4+ |
35-64 |
|
CD8+ |
7-15 |
CD4+/8+ |
85-95 |
CD8+ |
7-10 |
CD8+ |
19-30 |
|
γδ T cells |
0.5-1 |
|
|
B cells |
35-58 |
B cells |
9-15 |
|
B cells |
44-58 |
|
|
Monocytes |
2-3 |
Tregs |
2-3 |
|
Monocytes |
3.5-5 |
|
|
Neutrophils |
4-6 |
Dendritic cells |
0.5-1 |
|
Granulocytes |
1-2 |
|
|
Eosinophils |
1-2 |
|
|
|
NK cells |
1-5 |
|
|
NK cells |
4-7 |
|
|
|
iNKT |
1-2 |
|
|
iNKT cells |
0.2-0.5 |
|
|
|
Myeloid DC |
0.5-2 |
|
|
|
|
|
|
|
Lymphoid DC |
0.5-1 |
|
|
|
|
|
|
|
Plasmacytoid DC |
0.1-0.3 |
|
|
|
|
|
|
These values are for reference only and there may be variation due to sample preparation, individual variation, and the strain of animal used.
All values shown are percentages of total leukocytes in each sample.
For more information about the importance of cell frequency in your flow cytometry experiment, please read our full guide.


